
.png)
Stay in July — seasonality, economic momentum, and risk appetite are all pointing the same way. Here’s the full breakdown.
The market pulled back yesterday, July 7. Under normal circumstances, a red day in early July wouldn’t be worth a note. But over the past week, three completely independent bodies of research landed on our desk — seasonality data from Bespoke Investment Group, economic momentum readings from two separate models, and a flurry of investor-behavior signals from SentimenTrader — and every single one of them points in the same direction.
We think the weight of the evidence right now is about as one-sided as it gets.
A down June after a double-digit start — historically bullish
The S&P 500 closed out the first half of 2026 up just under 10% — a strong start to the year by any measure. But June itself was a down month, and that specific combination is rare. According to Bespoke Investment Group, 2026 is only the fourth year since 1983 in which the S&P 500 was up by double digits through the end of May and then declined in June.
The other three: 1989, 1991, and 2013. What happened next in each of those years? The market snapped back hard in July:
Three for three, and not by small margins. Framework: Bespoke Investment Group.

Zoom out and July’s track record gets even better. Bespoke’s data shows July has quietly become the strongest month on the calendar — and in years when the index entered July already up 10%+ on the year, July averaged +1.7% with gains 65% of the time.
Last 10 Years · 10-for-10
Each By At Least 1%
All Years Since 1983
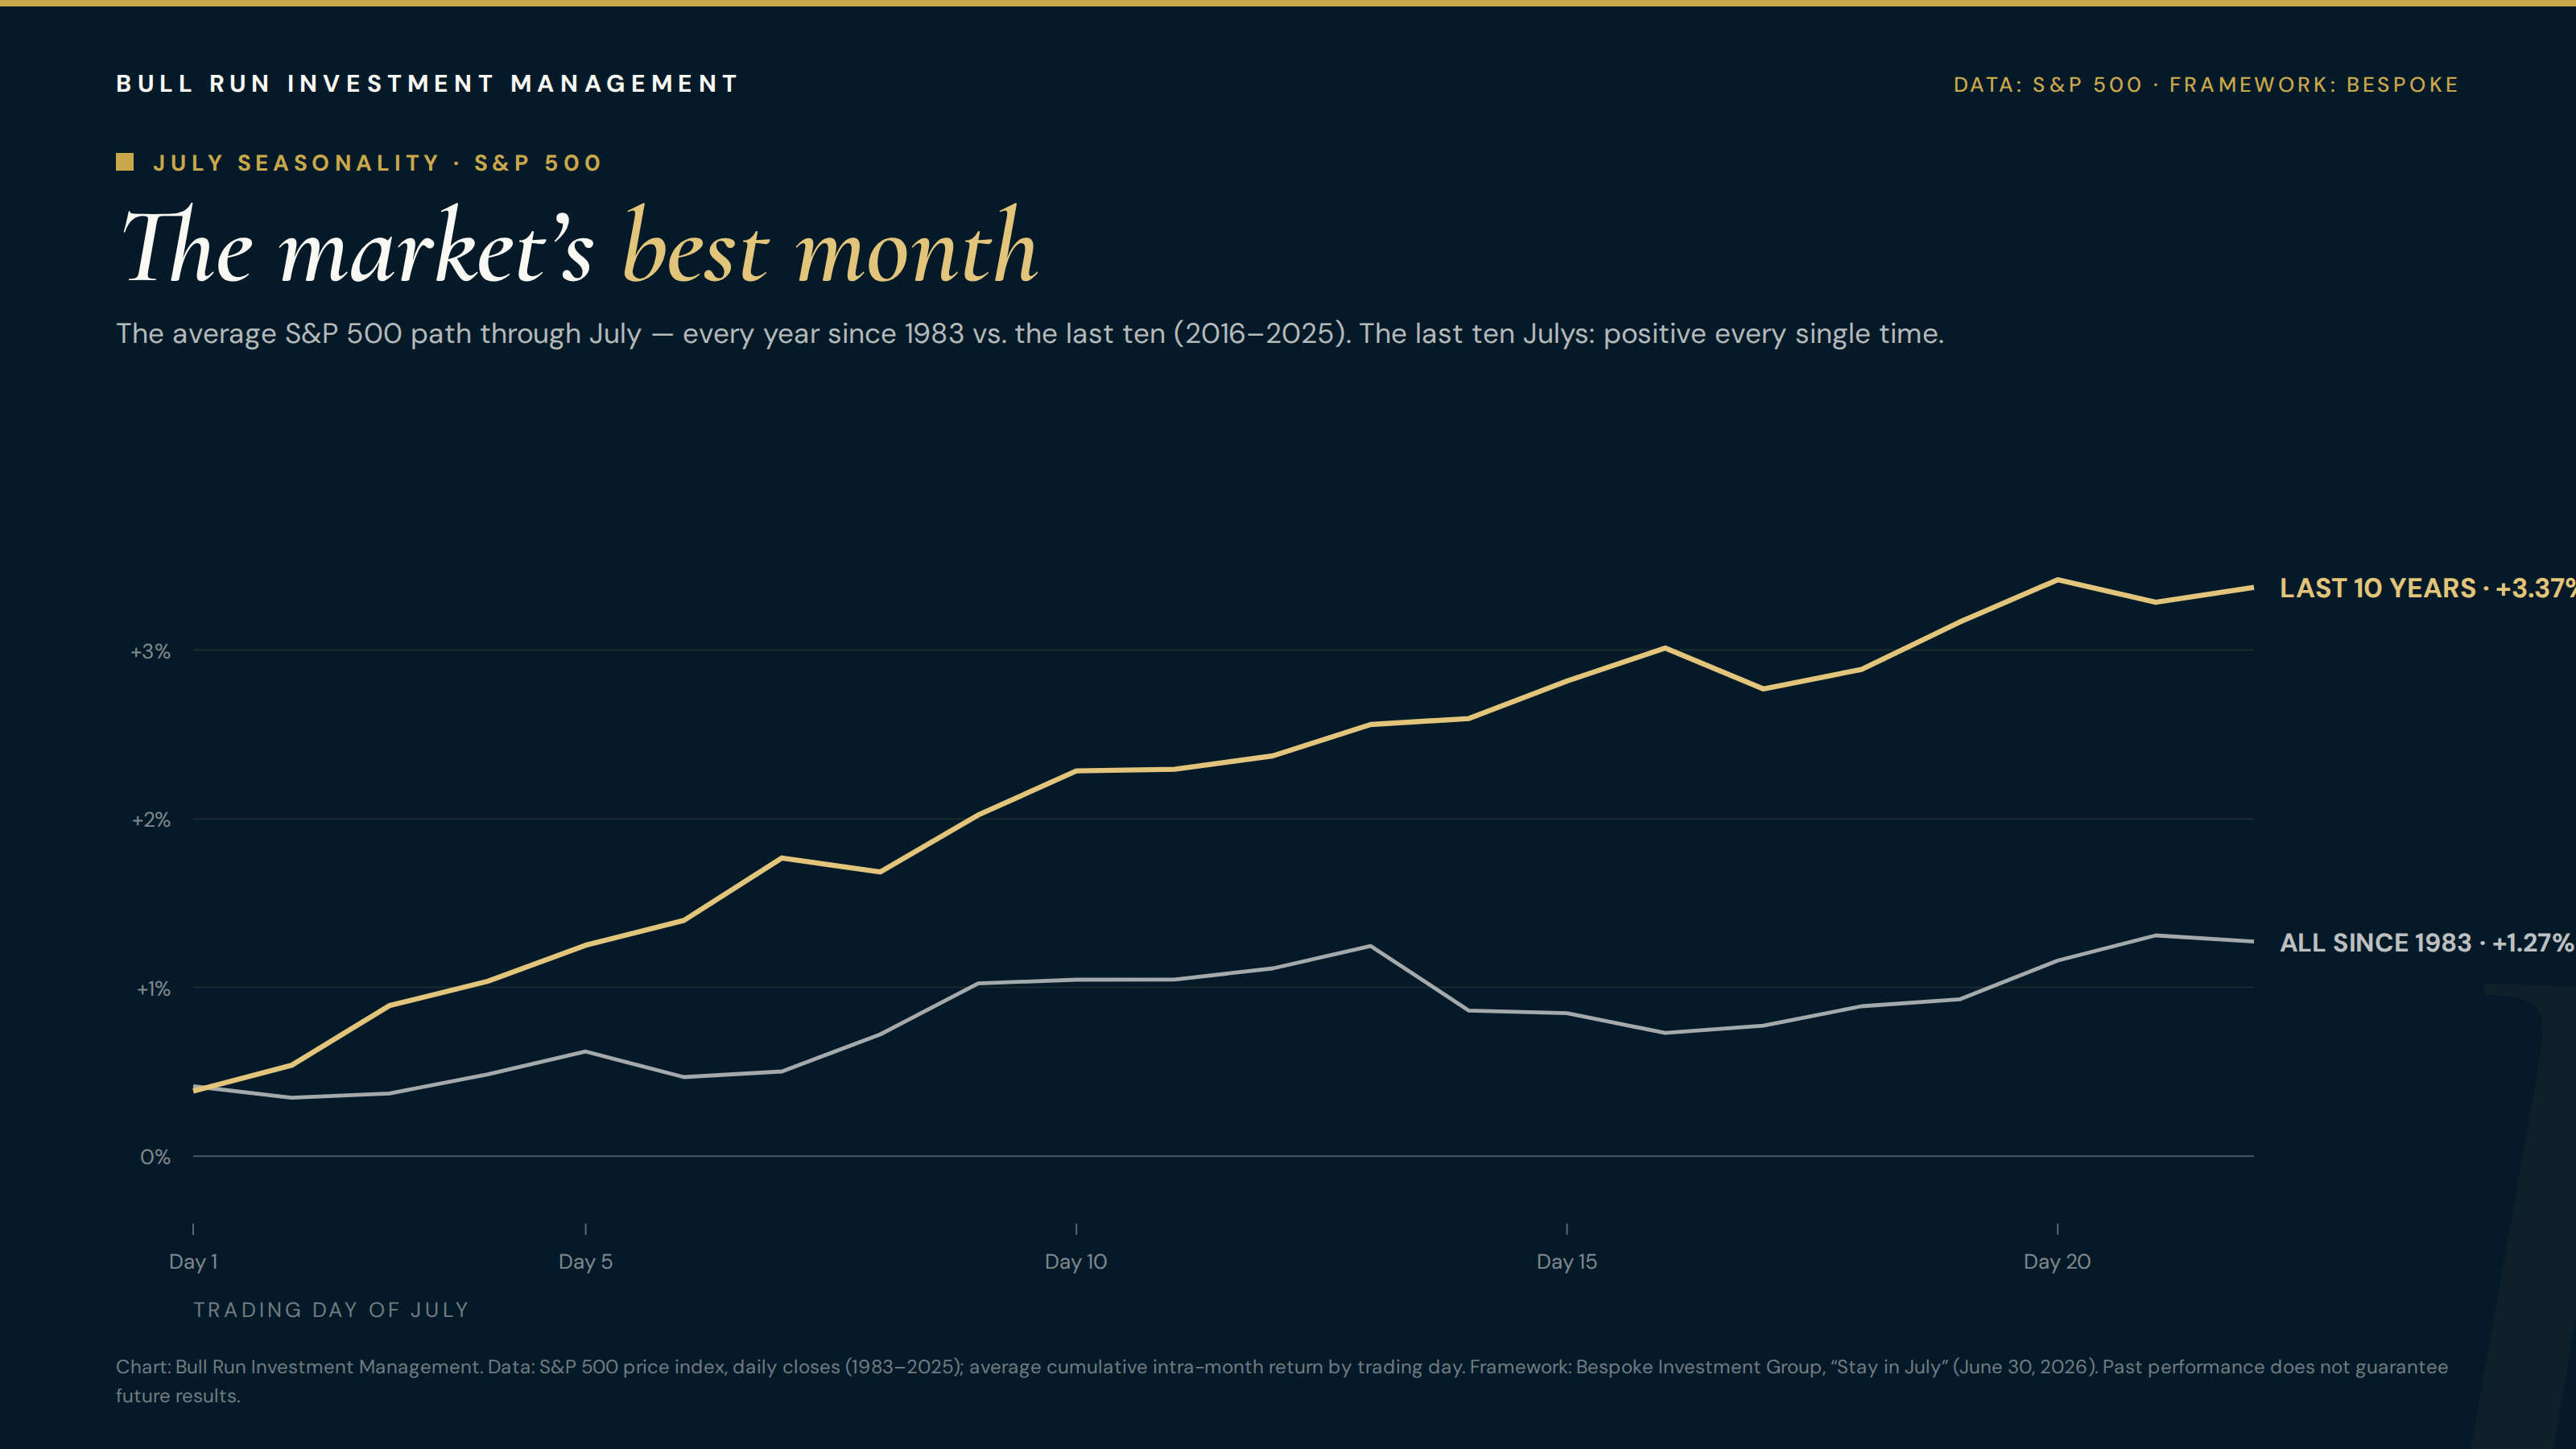
Seasonality alone is never a reason to invest. But it sets the table for what comes next.
The strongest economy reading since October 2024
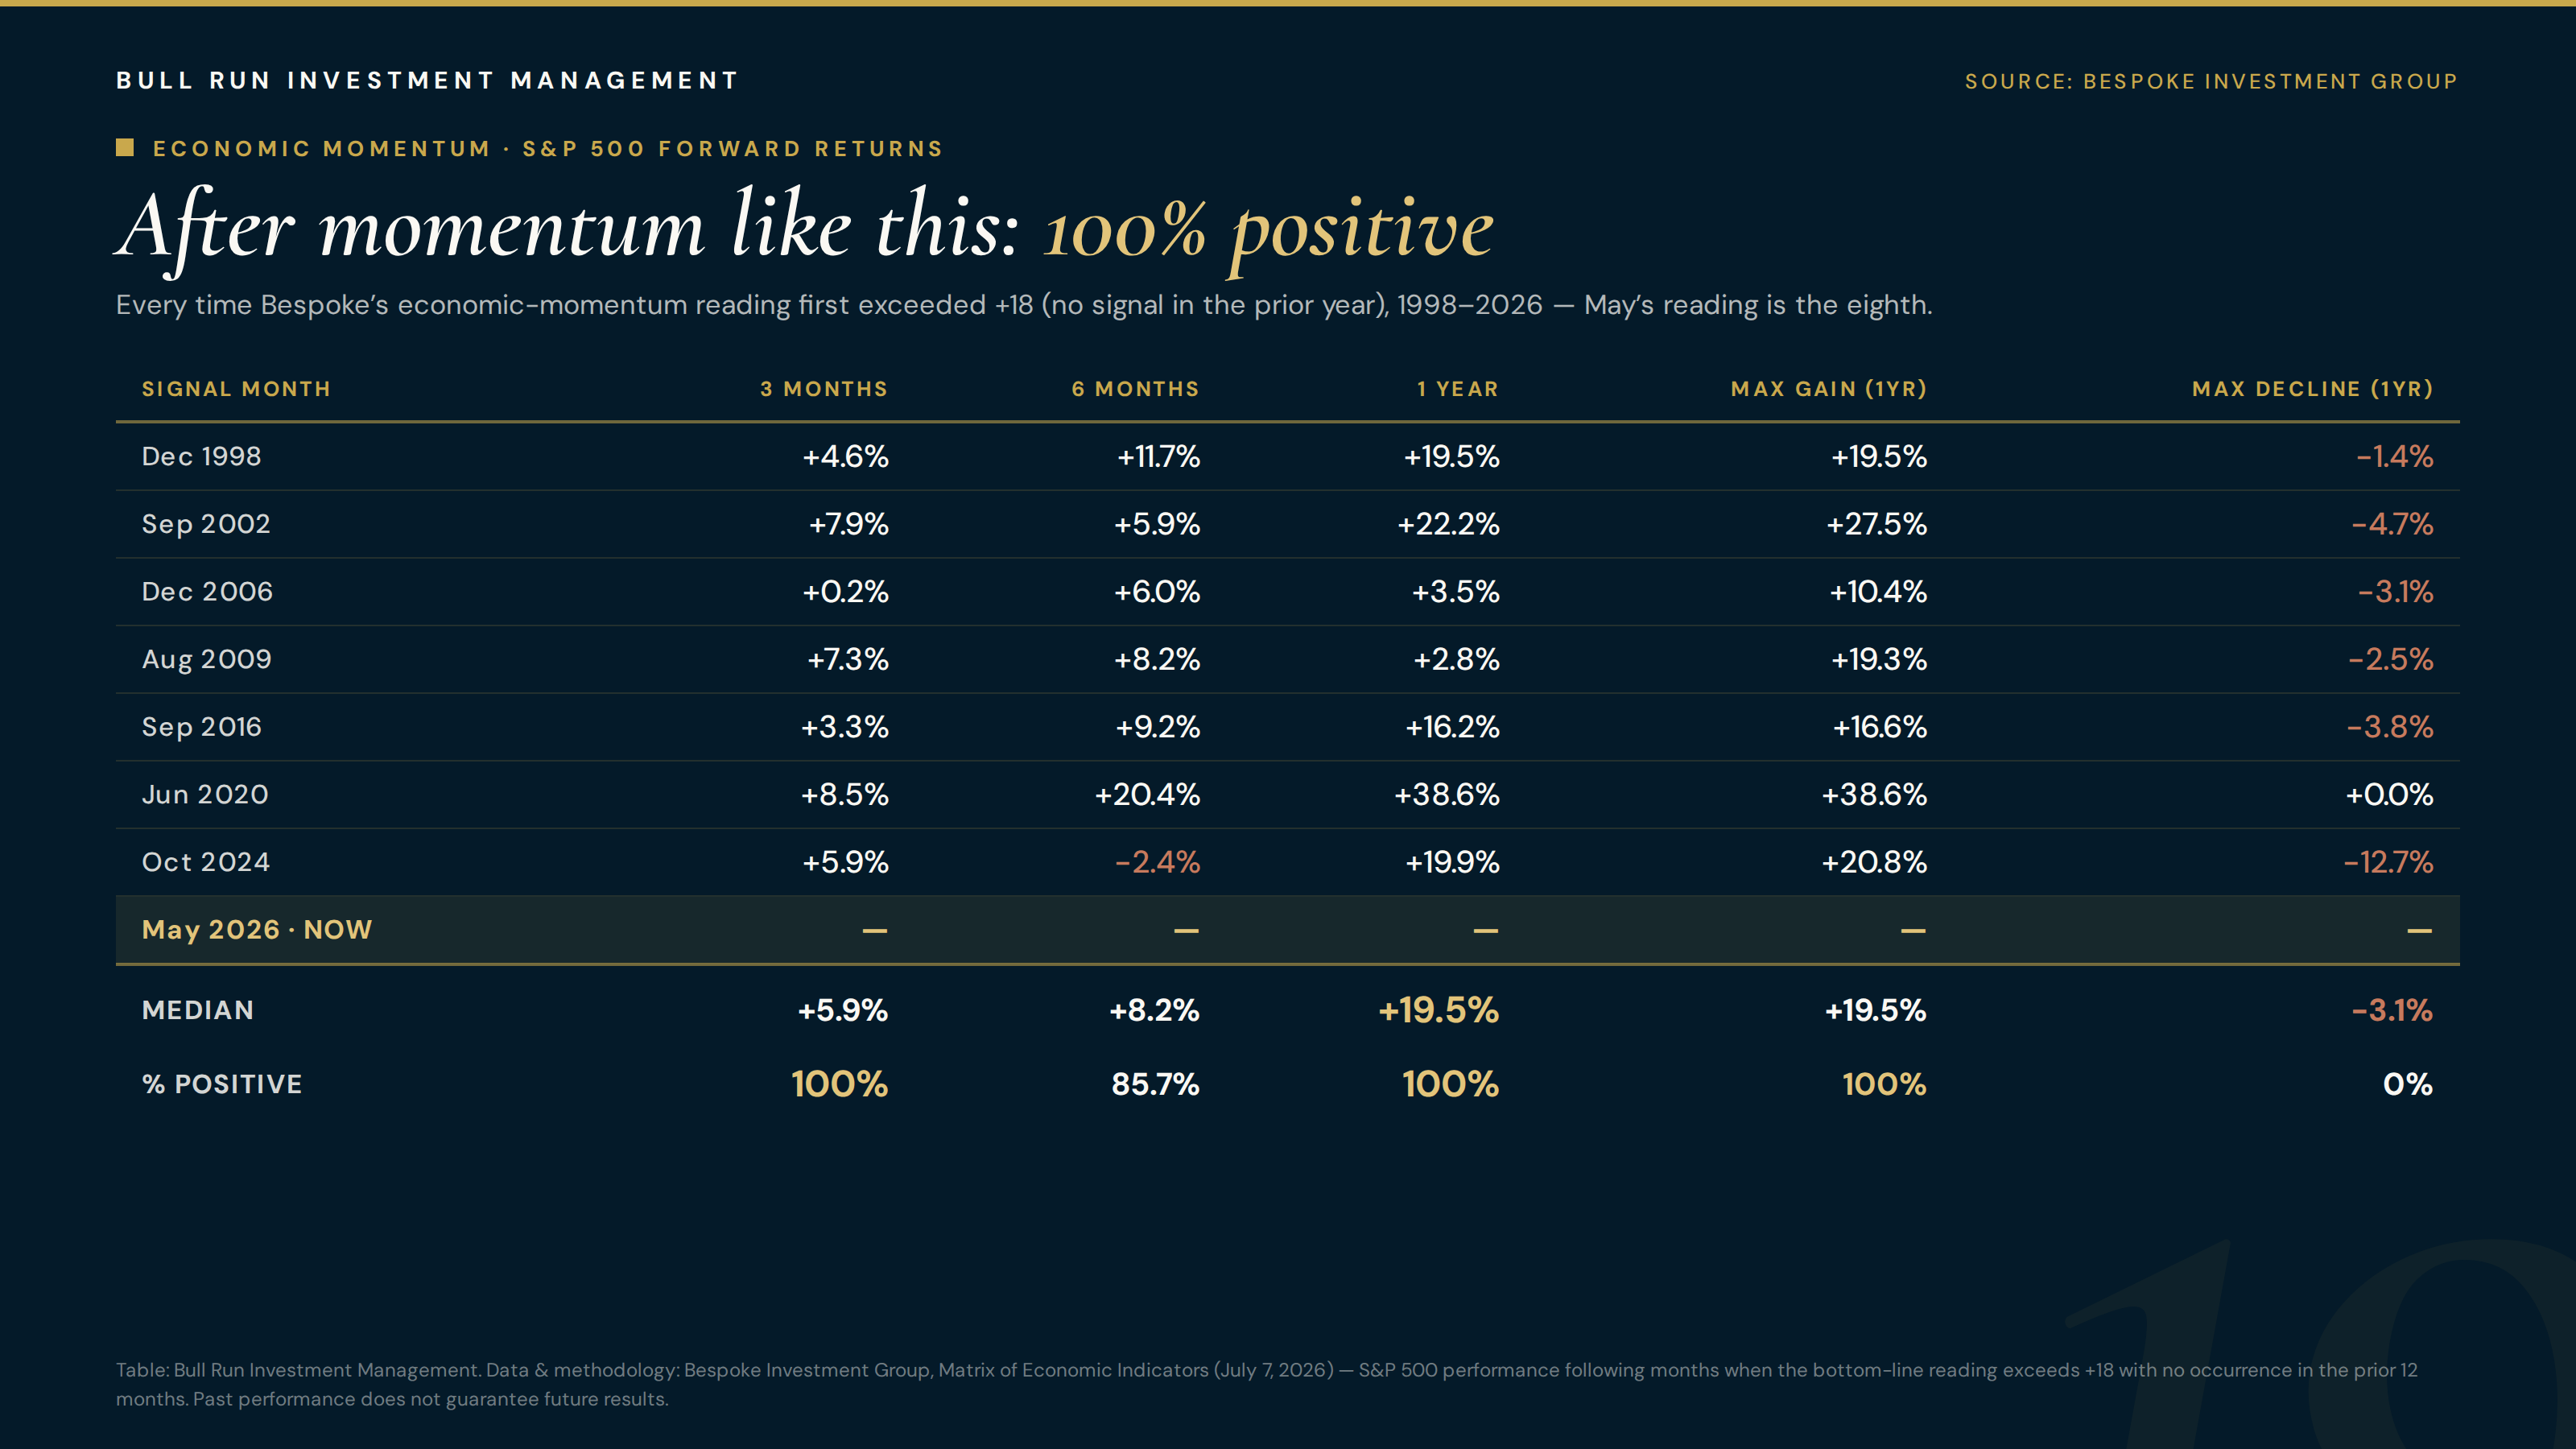
Every month, Bespoke updates its Matrix of Economic Indicators — a model that tracks the year-over-year momentum of more than 40 individual economic data series and nets out how many are improving versus deteriorating. Their latest update, covering data through May, showed the bottom-line reading rising to +19 — the strongest economic momentum reading since October 2024.
Here’s why that matters. When this reading has hit +19 or higher for the first time in over a year, it has been one of the most consistently bullish setups in Bespoke’s entire dataset. There have been seven prior first-time signals since 1998 — December 1998, September 2002, December 2006, August 2009, September 2016, June 2020, and October 2024. Following those signals:
Higher 100% Of The Time
All But One Higher
Higher 100% Of The Time
And in every single episode, the S&P 500 gained at least 10% at some point within the following year. Even the October 2024 signal — which fired directly into the tariff tantrum of early 2025 — finished the following twelve months up 19.9%.

Look at that list of dates again: August 2009. September 2016. June 2020. These readings have historically clustered near the launch points of major, multi-year rallies. Seven prior episodes is a small sample — Bespoke says as much — but the consistency is hard to ignore, and the direction of the economy and the stock market are strongly correlated over the long run.
The Leading Economic Indicators finally turned
It’s not just one shop’s proprietary model. On July 6, Jay Kaeppel at SentimenTrader highlighted that the Conference Board’s Index of Leading Economic Indicators — which had been in a prolonged decline — finally flipped to favorable in the most recent month. The LEI is a composite of ten forward-looking inputs (jobless claims, building permits, manufacturers’ new orders, the yield curve, and so on) that has historically turned down ahead of recessions and up ahead of expansions.


One interesting wrinkle from Kaeppel’s sector work: during +3 regimes going back to 1959, real estate has been far and away the best-performing sector — an 88% win rate with a median gain of +27.1% per episode — followed by technology, energy, and financials. We remain focused on our highest-conviction areas, but it speaks to how broad these regimes have historically been.
Investors aren’t just feeling bullish — they’re acting bullish
This is the piece we find most fascinating, and it requires an important distinction that Kaeppel draws in his June 30 report. Bullish sentiment — how investors say they feel — is often a contrarian warning sign. Risk-on behavior — what investors are actually doing with their capital — is different. When money is genuinely flowing toward the riskier corners of the market, it has historically signaled a durable, sustainable bull market rather than a fragile one.


Individually, Kaeppel is careful to call these “weight of the evidence” indicators rather than standalone trading signals. But the sheer number of them firing within a single week — microcaps, high beta, IPOs — tells you that capital is aggressively rotating toward risk, not away from it.
Why the confluence matters
Any one of these data points is interesting. Together, they describe something bigger:
Strong economic momentum plus genuine risk appetite is the combination that has historically shown up near the beginning of major advances — think August 2009, September 2016, June 2020 — not the end of them. None of these indicators is a guarantee, sample sizes are modest, and every cycle has its own character. But when seasonality, the economy, and investor behavior all point the same way at once, we pay attention.
We’ve seen this movie before
If this framework sounds familiar, it should. On March 27, 2026 — with the Equity Innovation SMA down 21.8% year-to-date at the March 26 close — and still falling; the true bottom came two sessions later, on March 30, at −27.2% — with software valuations at their cheapest levels since 2015 — we published When Sentiment Breaks and Growth Doesn’t, arguing that the drawdown was a sentiment event rather than a fundamental one, and a rare entry point. The IGV Optix indicator had just flashed extreme pessimism for only the third time in 18 years (the prior two: October 2008 and March 2020), and we maintained our full-year outlook for the Innovation strategy rather than backing away.
It didn’t feel good to be bullish that week. It rarely does at the lows. Here is the whole story, traced day by day from the live database — and you can view every number gross, or net of your own advisory fee:
Three dates to hold onto: March 27 — the day we published. March 30 — the actual bottom, two trading days later. June 30 — quarter-end.
And the three-month scoreboard, measured from the March 26 close — the last trading day before we published — against everything:
Live from the BRIM Master Database, gross daily returns unless a fee is entered above; benchmarks always gross.
Put precisely: the Innovation strategy stood at — year-to-date on March 26, 2026. Three months later, on June 30, it stood at — year-to-date — a —-percentage-point recovery inside a single quarter. Measured from the absolute bottom on March 30 (— year-to-date), the swing was — points.
Note the dip in early 2026 — that is the entire drawdown from the chart above, seen in context. Even at its worst, an investor from the April 2025 low was still up.
We don’t bring this up for a victory lap — we bring it up because the process is the point. Extreme pessimism plus intact fundamentals was buyable in April 2025, it was buyable in March 2026, and the same discipline is what has us leaning in today rather than flinching at a red tape.
A mid-year checkpoint: the record behind the conviction
Everything above is the market’s evidence. Here is ours. With Q2 in the books, we refreshed our calendar-year rankings of the Equity Innovation SMA against the complete universe of non-leveraged ETFs — every fund in America with a full track record over each period, using YCharts total-return data. Through June 30, 2026:
| Year | Innovation SMA | S&P 500 | Percentile Rank | Funds in Universe |
|---|---|---|---|---|
| 2023 | +98.4% | +26.3% | Top 1.18% | 3,479 |
| 2024 | +39.3% | +25.0% | Top 3.10% | 4,061 |
| 2025 | +35.2% | +17.9% | Top 8.12% | 4,854 |
| 2026 YTD | +17.1% | +10.3% | Top 17.34% | 5,969 |
| Since Jan 2023 | +337.4% | +105.2% | Top 0.75% | 3,479 |
Add it up and the Innovation SMA has delivered a +337.4% cumulative return since January 2023 — a 52.6% annualized pace — ranking #27 out of 3,479 non-leveraged ETFs. Only 26 funds in the country did better over that stretch, and our average calendar-year percentile rank from 2023 through 2025 sits in the top 4.13%. (All figures gross of advisory fees; 2026 is a partial year through June 30.)
Don’t take our word for it — verify it yourself, live →The full comparison table is public: every fund, every calendar year, every rank, powered by the same database that runs our client reporting. We believe in showing our work.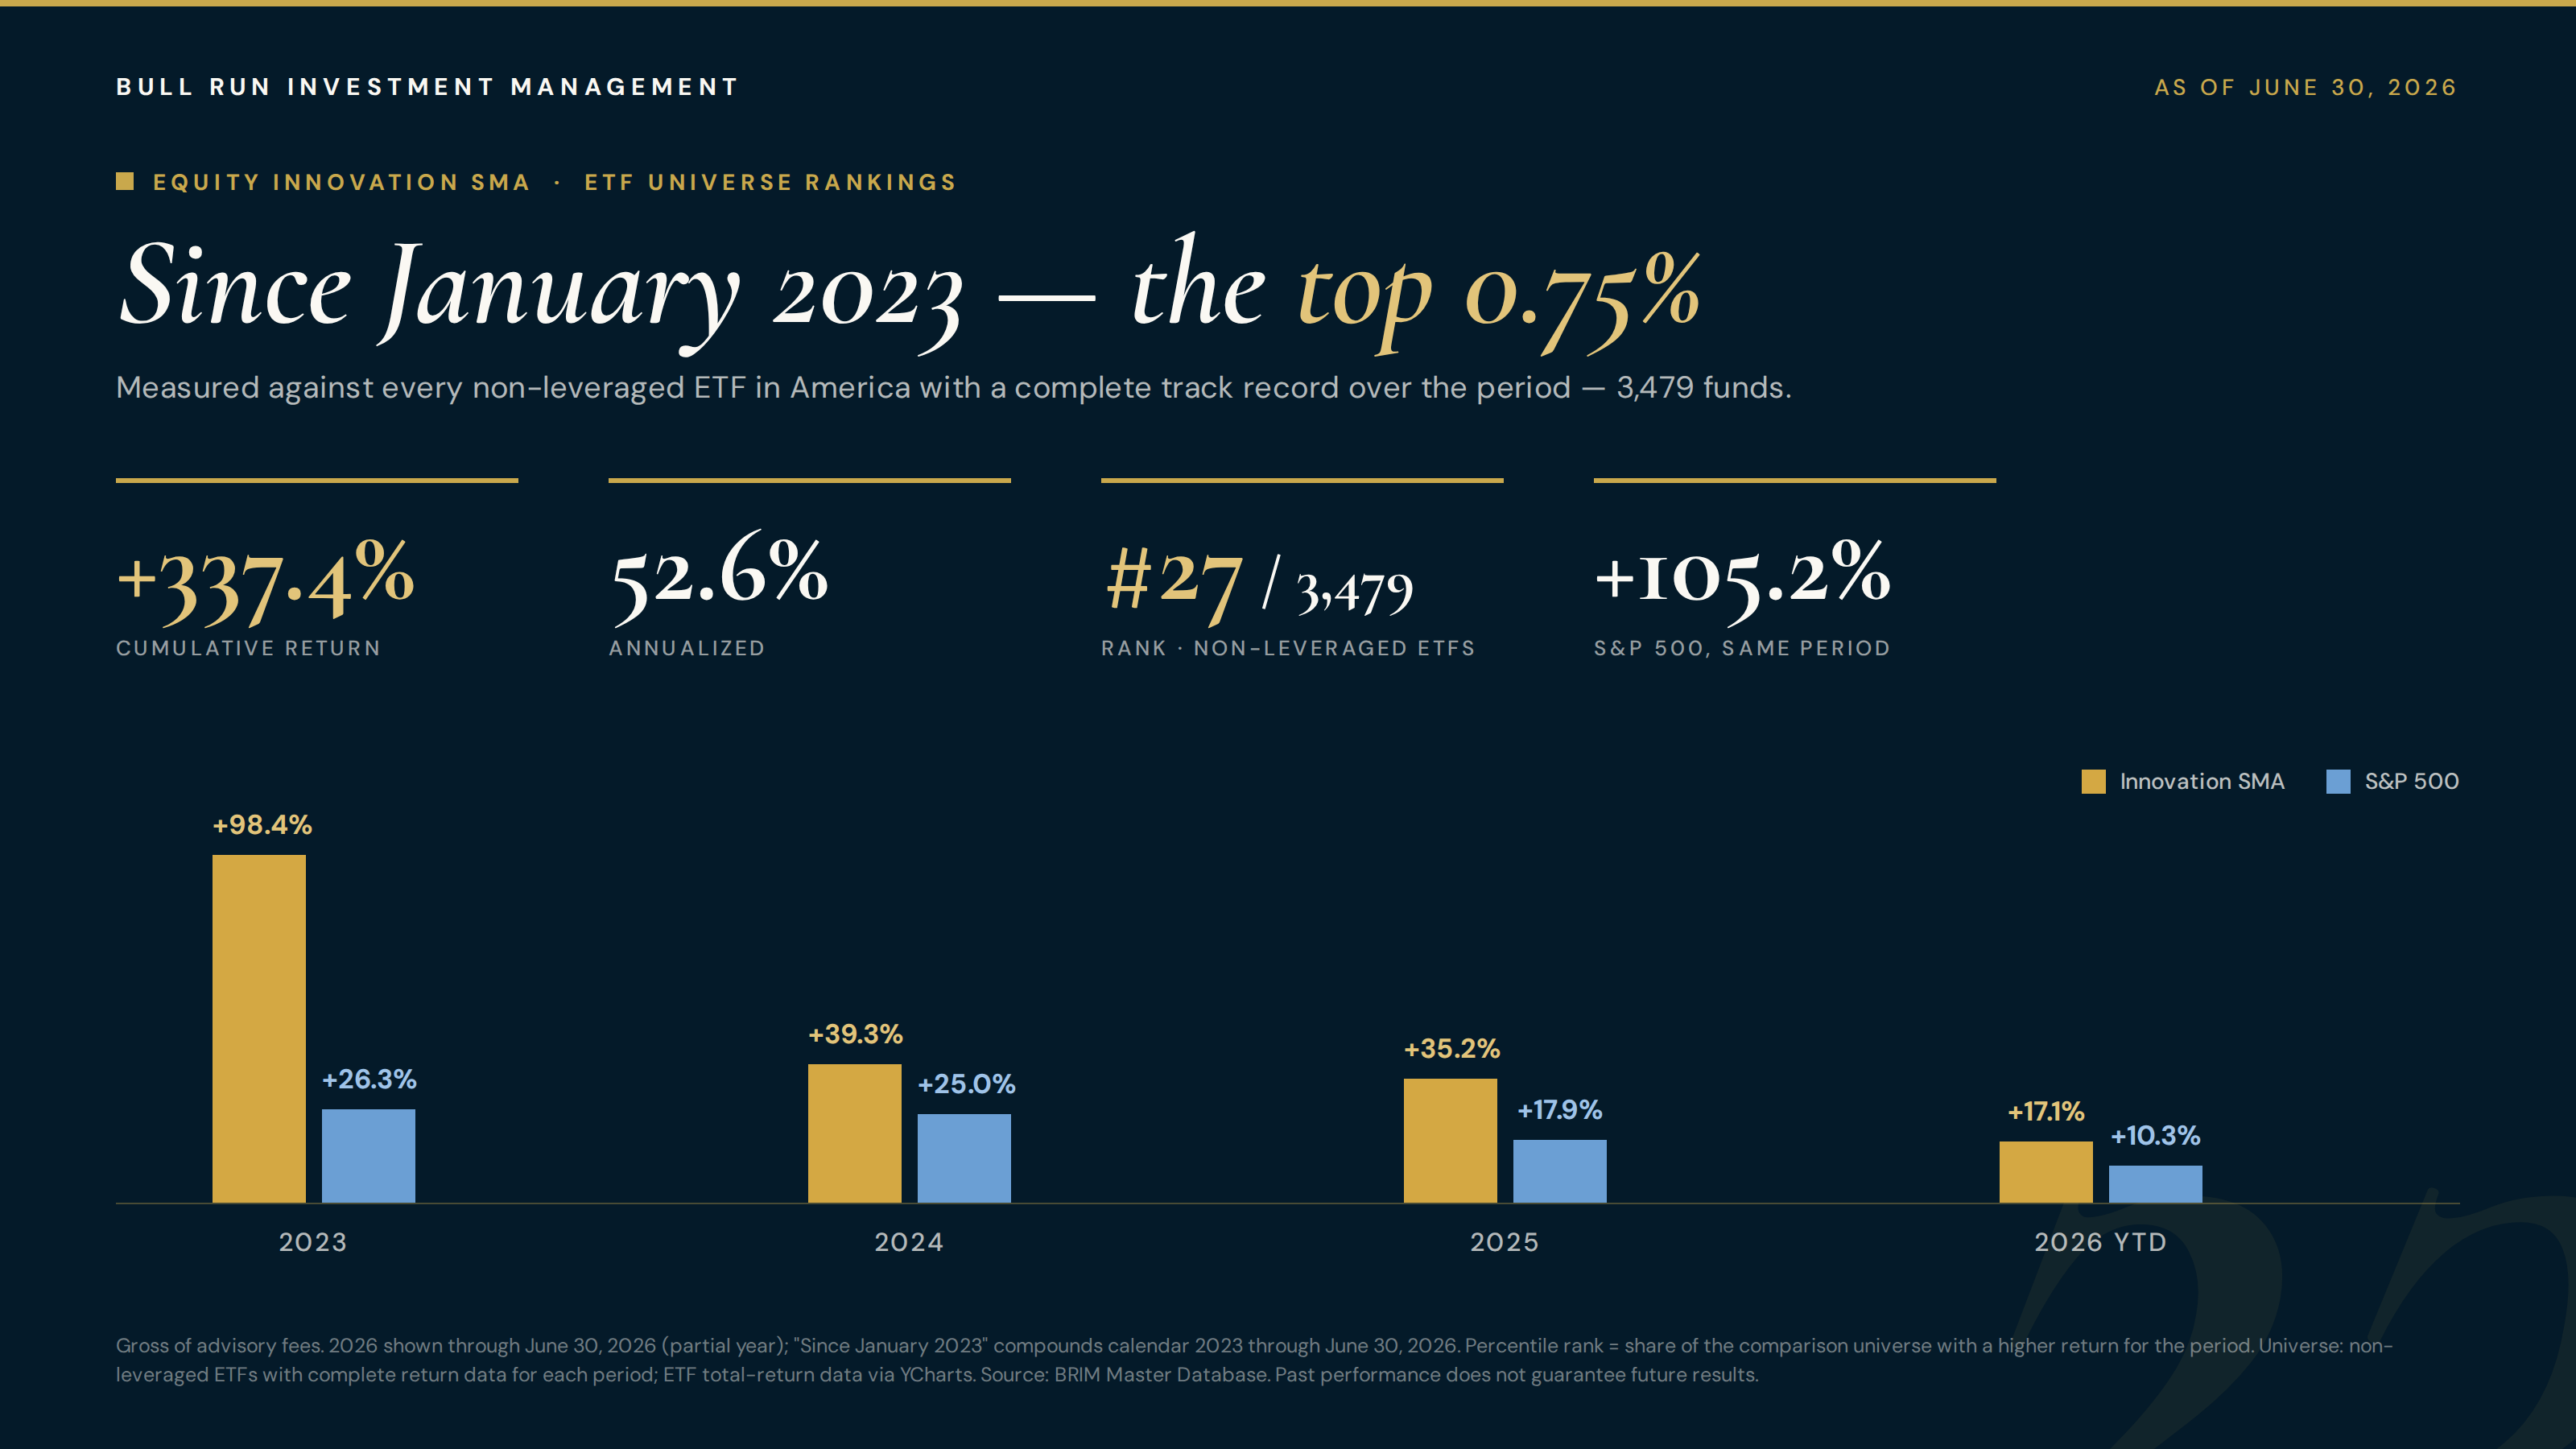
And because a percentile can feel abstract, here is the entire universe on one chart — all 3,479 funds, ranked best to worst by cumulative return since January 2023. Notice the shape of the curve: returns don’t rise evenly across the field, they go exponential inside the top 1%. The median fund earned +57.6% over the period. The top-5% cutoff was +173.5%. The Innovation SMA — the gold point at #27 — returned nearly twice the top-5% cutoff and 5.9× the median fund.
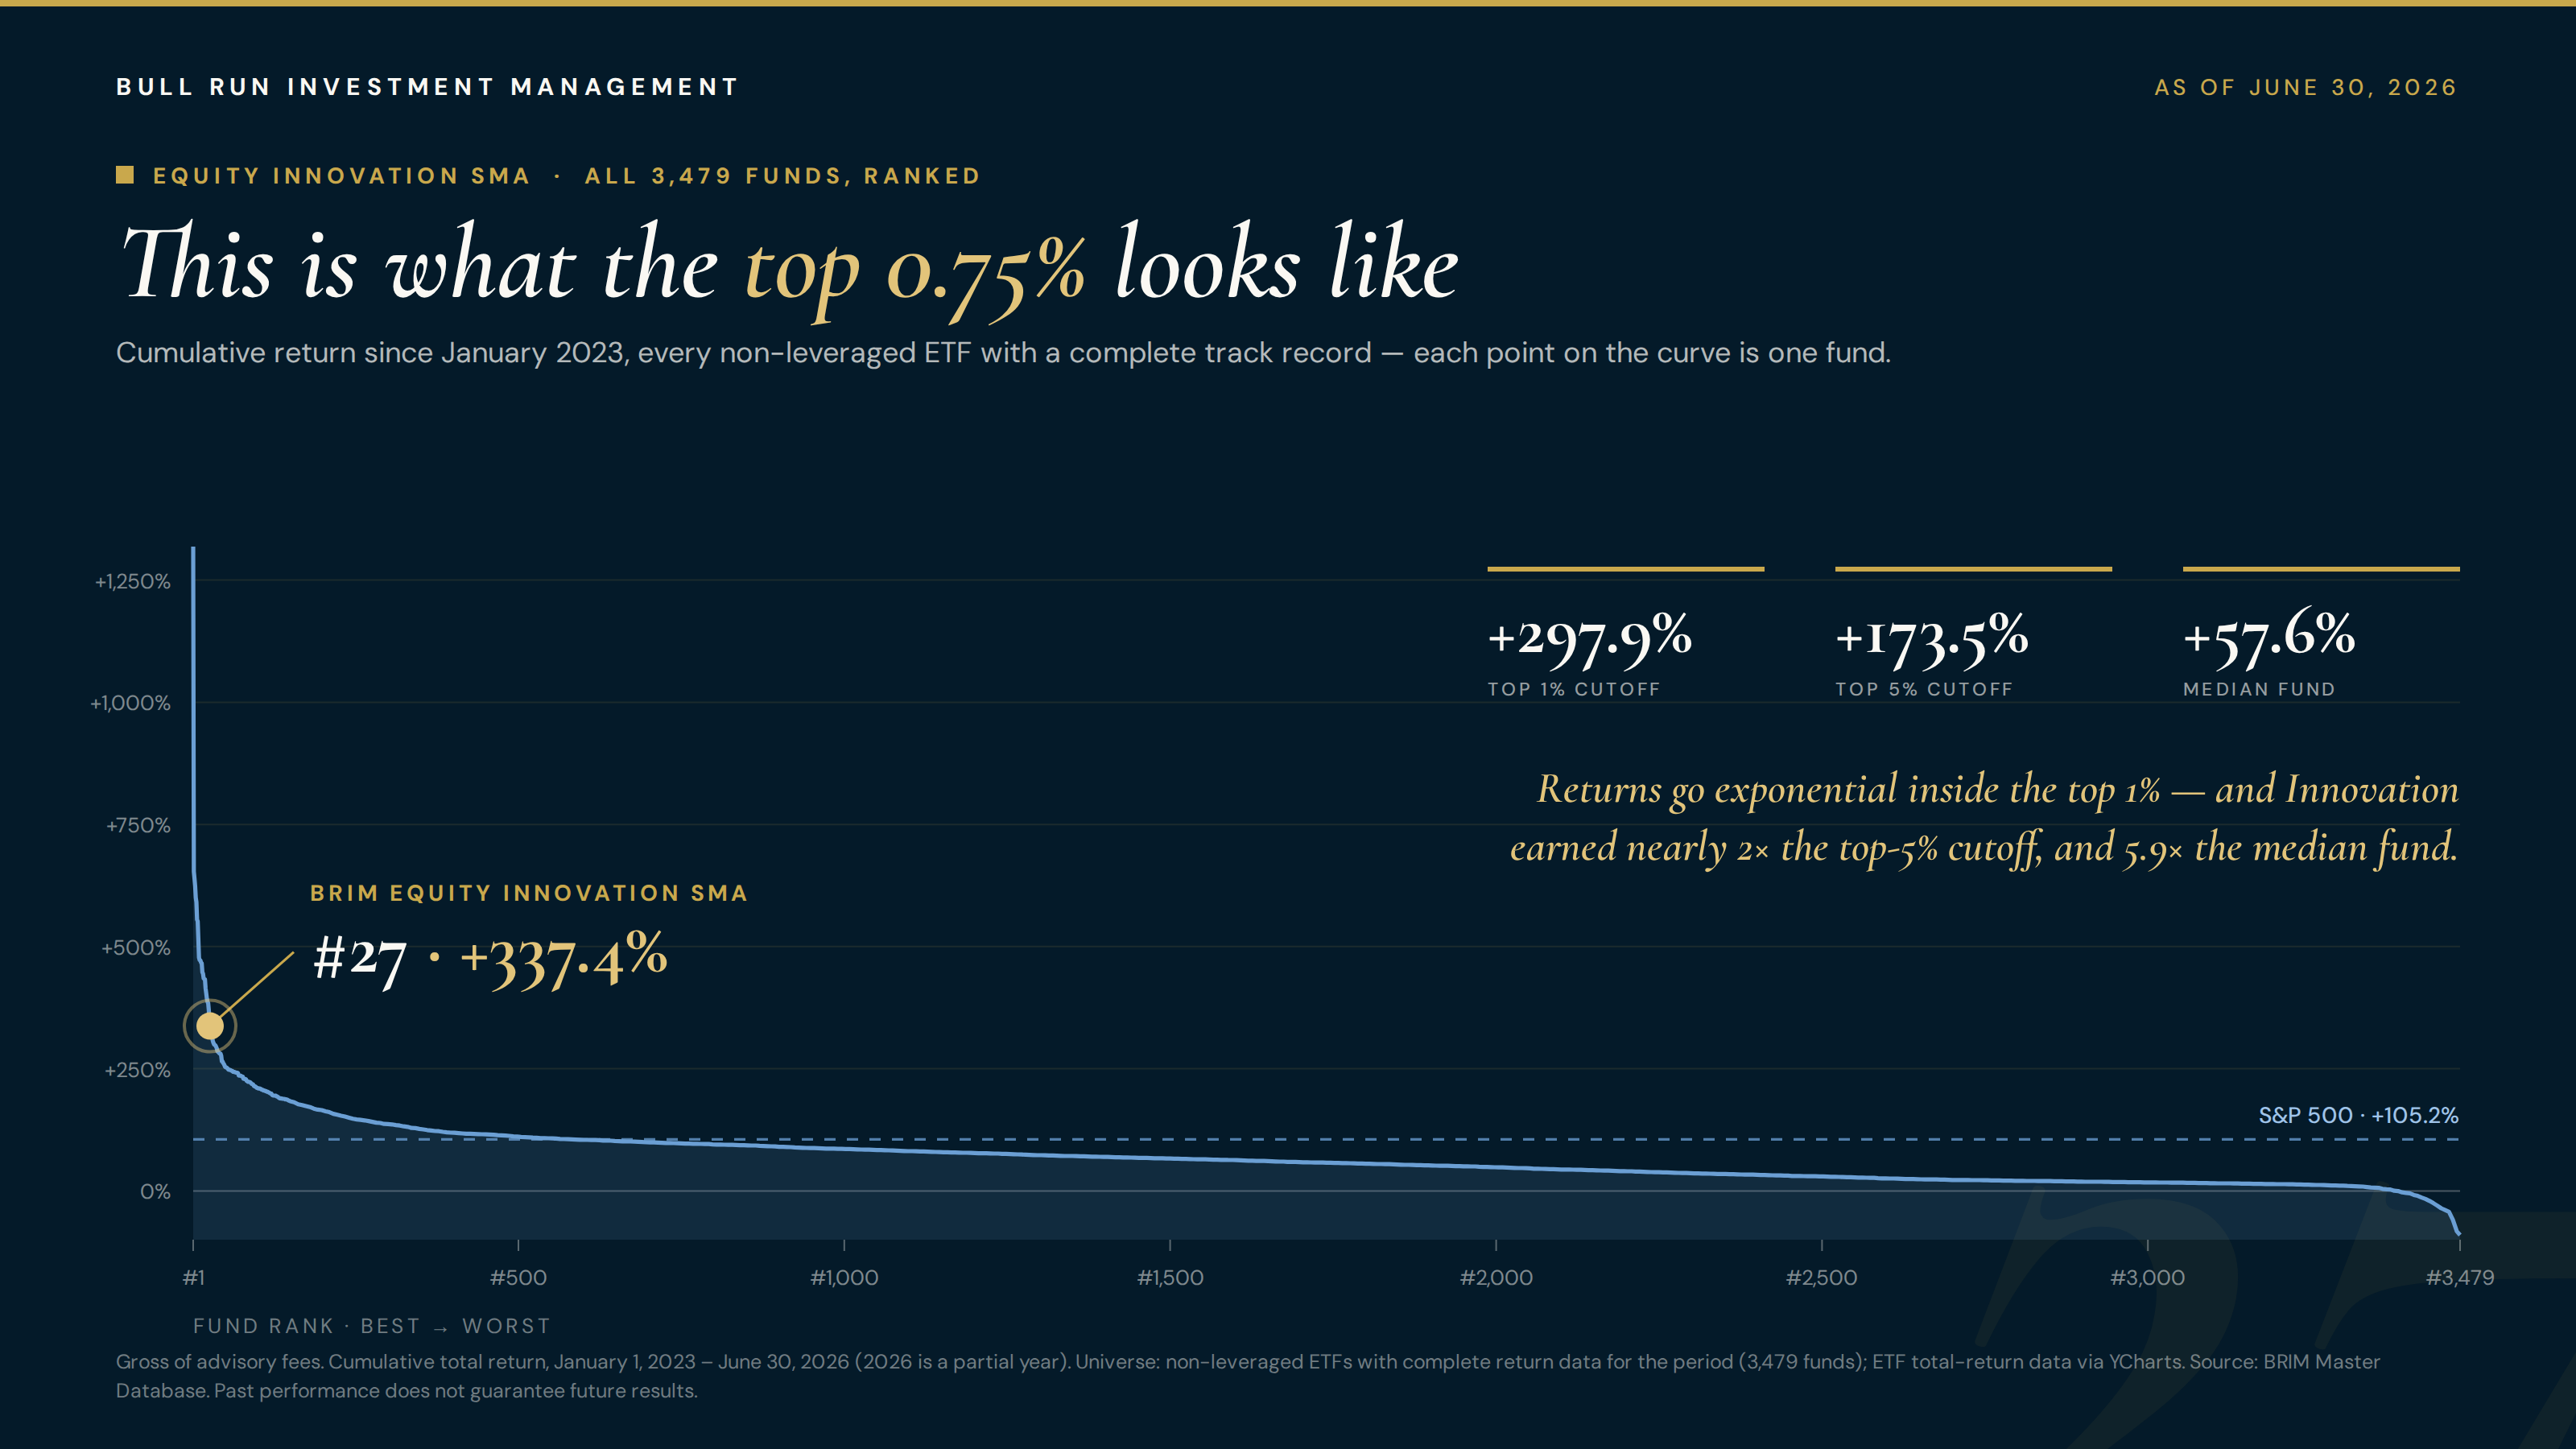
We share this for one simple reason: every signal in this note says be invested — and this is what we’re invested in. The same concentrated, highest-growth-companies approach that produced that record is exactly what we’re carrying into the second half.
All four BRIM equity SMAs — Innovation, Growth, Core, and Low Volatility — are available to outside advisors through the Charles Schwab Managed Account Marketplace. If you’ve been looking for a differentiated growth sleeve for your clients, the live rankings table above is exactly what your due-diligence process wants to see. Reach out and I’ll walk you through it.
Talk directly with the portfolio manager — not a sales team. We’ll walk through your goals and how our four proprietary SMA strategies fit.
Book a MeetingThe bottom line
Yesterday, July 7, was a pullback. In our view, it was also a gift. The economy is accelerating, investors are rotating toward risk, valuations across our highest-growth holdings remain reasonable relative to their fundamentals, and we’re standing at the front edge of the market’s historically strongest month — in a setup that has never once resolved lower over the following twelve months in more than forty years of data.
Our positioning is unchanged: fully invested, concentrated in the fastest-growing companies in AI, software, and cloud infrastructure. If you’re holding cash on the sidelines, history suggests this is precisely the kind of moment to put it to work.
Stay in July.
Your introduction to Bull Run starts here.
Schedule a complimentary, no-obligation call so we can understand your financial goals and show you exactly how our proprietary SMA strategies are managed — or send a note below and Chris will reach out directly.