
A Standout Year: BRIM’s Portfolio Performance in 2024 & What’s Next for 2025
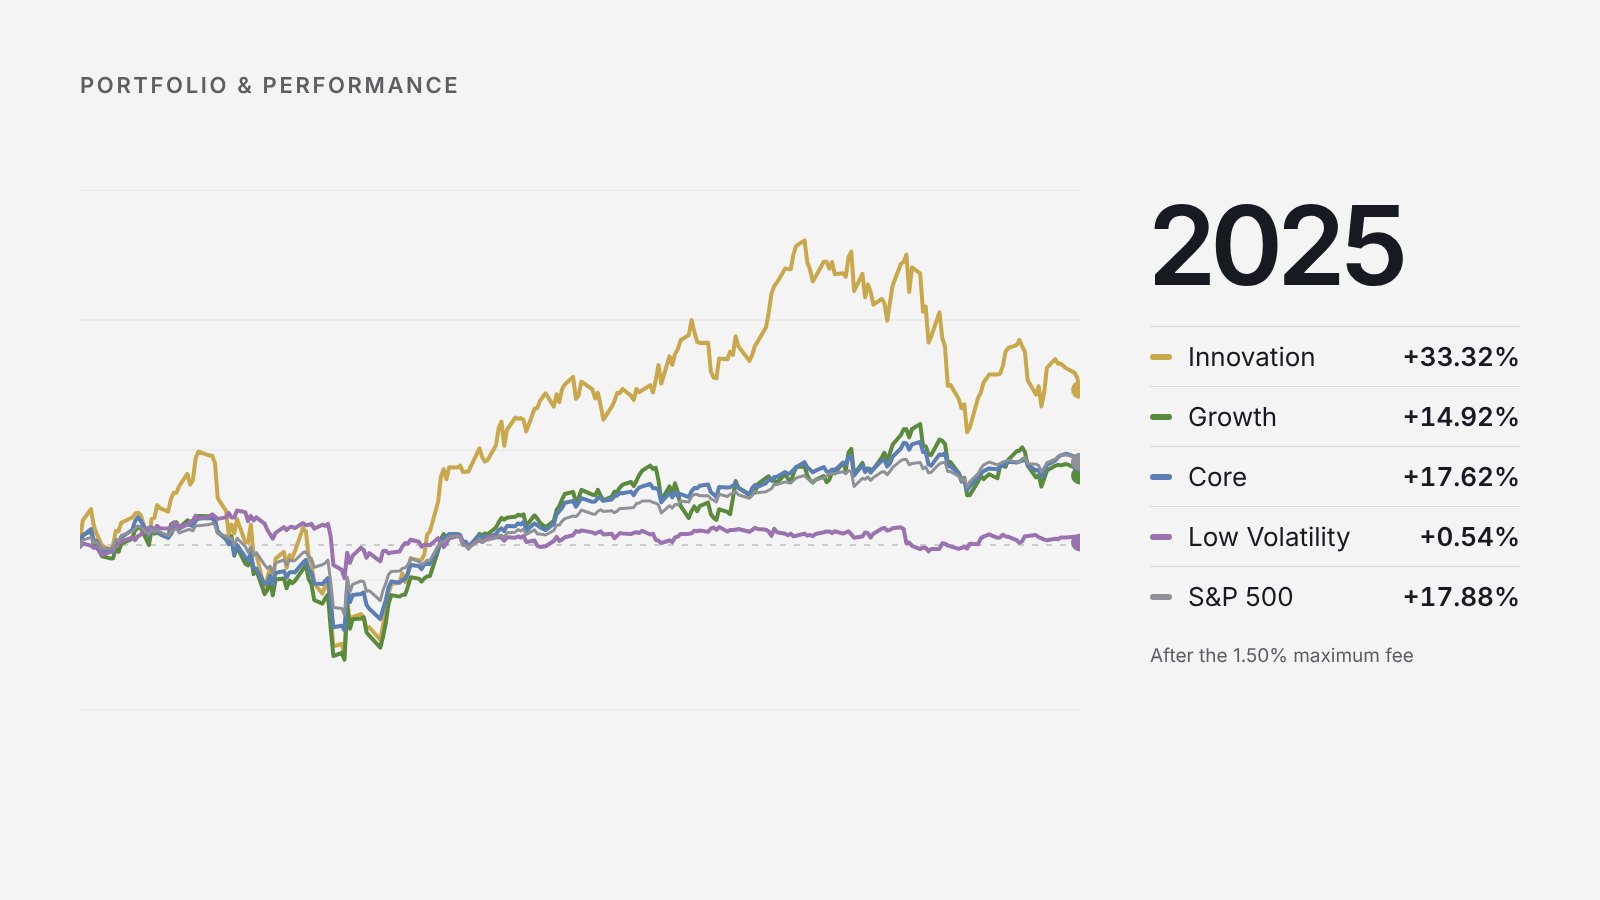
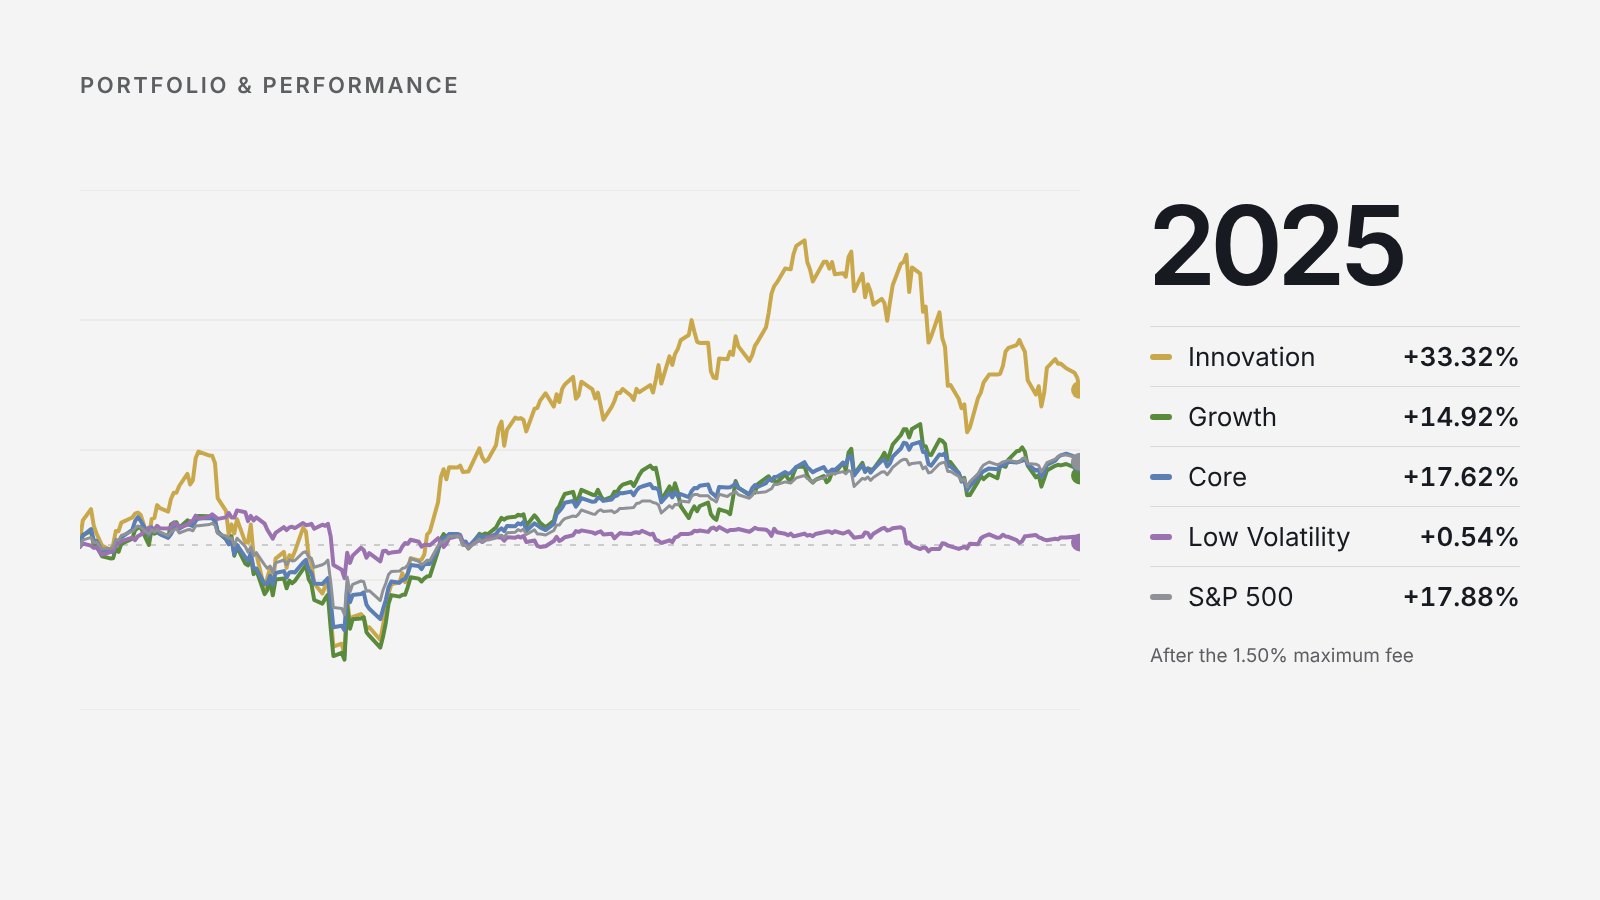
All four Bull Run strategies beat their indices in 2024 after fees. Calendar-year returns for each, and what comes next in 2025.
A Standout Year: BRIM’s Portfolio Performance in 2024 & What’s Next for 2025
2024 was an exceptional year for Bull Run Investment Management, with all four of our proprietary SMA portfolios delivering strong performance and outpacing market indices. Our disciplined investment approach, focused on high-growth opportunities, active risk management, and a deep understanding of market dynamics, has continued to generate outstanding results for our clients. As we look ahead to 2025, we remain confident in our strategies and are excited to share our outlook for the coming year.
BRIM’s proprietary managed portfolios - consisting of our Equity Innovation, Growth, Core, and Low Volatility SMA’s - substantially outperformed the indices in 2024 after fees. Our Separately Managed Accounts consist of a mix of individual stocks and etf’s, and allow for optimal tax efficiency and direct ownership of individual securities within your investment portfolio, providing an ideal investment portfolio structure.
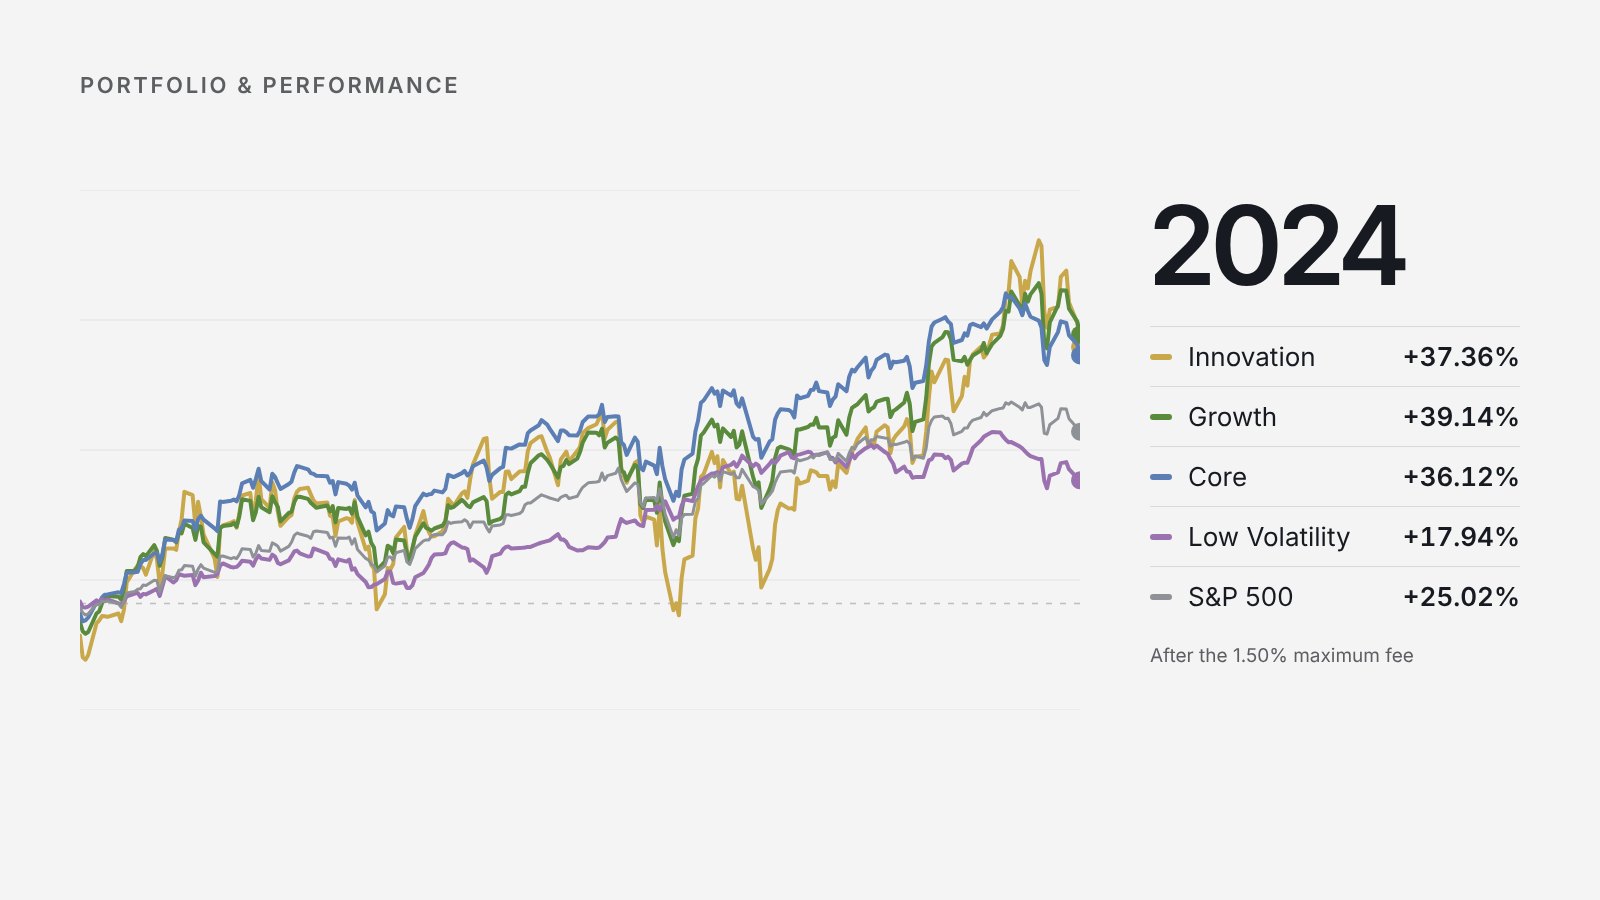
Below are Calendar year 2024 returns for our 4 proprietary SMA models. Returns are shown gross of fees in the return graphs, and net of fee returns are reported and calculated based off our highest maximum annual fee of 1.50%.
Equity Innovation (Net of 1.5%): +37.21%
Equity Growth (Net of 1.5%): +38.77%
Equity Core (Net of 1.5%): +35.96%
Equity Low Vol (Net of 1.5%): +18.19%
Each of our portfolios met or exceeded their objectives for last year. 2024 was a wonderful year for performance, and within our Innovation Portfolio, we are expecting another above average year of performance for 2025.
In 2024, for context, the S&P 500 returned 25.0%, with dividends included. Below are returns for our 4 Proprietary portfolios. Each of our top 3 portfolios, including our Equity Core, Equity Growth, and our Equity Innovation Portfolio, outperformed the S&P, minimally, by an additional 44% last year, or 11% in absolute terms.
What Drove Returns for our Portfolio’s in 2024
Equity Innovation
Gross of Fees: 39.3%
Net of 1.5%: 37.21%
Our Equity Innovation portfolio is our highest growth portfolio, and is designed to outperform the S&P 500, Nasdaq, and all other market benchmarks. Notable winners in 2024 were Nvidia, Soundhound AI, Reddit, and etf’s FNGU and USD, which lead to strong outperformance for the year. We went into late December of 2023 with Nvidia as our highest position at the time, doubling our exposure to it in anticipation of the shares approximately tripling (increasing by 200% in value) in 2024. We weren’t off by much, with Nvidia returning 171.2% for the year. Reddit was acquired towards the end of the summer in July, for an end of year return of 161.4% in just over 5 months. Our best pick of all this year was SoundHound AI, purchased for approximately $6.64 a share on November 19th, and sold for $21.01 a share on December 18th, resulting in a 216.5% gain in just under one month.
Equity Growth
Gross of Fees: 40.9%
Net of 1.5%: 38.77%
Our Equity Growth portfolio was our top performing model portfolio in 2024, with a gross return of 40.9% for the year. This portfolio is designed to outperform the S&P 500 and the Nasdaq. Notable winners last year for our growth portfolio were Palantir Technologies, Nvidia, Broadcom, and Meta. Palantir, which we acquired in May of 2024, was our highest performing stock in the portfolio for the year, closing out the year with a total return of 202.4%. We recently took profits on this stock in February of this year. Nvidia, as noted earlier, returned 171.2% for the year, with Broadcom and Meta following at 111% and 66.3% respectively, in unrealized gains. Semiconductors broadly speaking had an incredible year in 2024, helping Broadcom and Nvidia produce high returns, with Palantir leading the portfolio to close out the year representing the largest holding.
Equity Core
Gross of Fees: 37.8%
Net of 1.5%: 35.96%
Our Equity Core portfolio surpassed expectations this year, outperforming it's benchmark, the S&P 500, by 12.8% gross of fees. Designed to outperform the S&P during up years and match it's downside during down years, the Core Portfolio consists of stable blue chip companies with above average growth that are established leaders within their Industries. Nvidia and Taiwan Semiconductor lead our Core Portfolio this year, with returns of 172.1% and 91.4% respectively. Other notable companies were Netflix, Meta, and Fortinet, with 83.2%, 66.5%, and 61% returns respectively. Our top holdings for the year reflects the theme of our core portfolio of blue chip companies that represent established leadership within their industries, such as Nvidia leading the adoption of artificial intelligence, Taiwan Semiconductor as the world's largest chip Foundry, Netflix the world's leading streaming provider, Meta, the world's largest social media company, and Fortinet a US leader in cyber security.
Equity Low Volatility
Gross of Fees: 19.96%
Net of 1.5%: 18.19%
Our Equity Low Volatility portfolio delivered a 19.96% gross return in 2024. While this strategy is not a primary allocation for most clients, several accounts were invested for the majority of the year, and their performance closely mirrored the model portfolio. Designed to provide consistent returns with lower downside risk, the Low Volatility portfolio focuses on companies with strong cash flows, defensive positioning, and industry leadership. Our top performer for the year was Virtu Financial, a leading market-making firm, which benefited from increased trading volumes and volatility and returned 62.1% for the year. Other performers included Walmart, up 50.6%, capitalizing on strong consumer spending and retail dominance, Apple up 37.7%, continuing to leverage its ecosystem and AI-driven innovations, 3M up 37.4%, rebounding with cost-cutting measures, and Fiserv up 35.2%, a fintech leader gaining from growth in digital payments.
3 Factors to Determine to project the Market for 2025
There are multiple ways to analyze the market, and the approach can vary depending on the kind of year we've had. While future earnings expectations and P/E ratios are always relevant, certain factors become more significant based on recent market performance.
- The market has delivered two consecutive years of 20%+ gains of back-to-back returns.
- The current P/E ratio is above 28, signaling historically speaking elevated valuations.
- Full-year 2025 earnings projections remain a crucial anchor, and applying an interest rate-adjusted P/E to these estimates helps determine fair valuations.
By examining these factors in context, we can better assess where the market is headed and set realistic expectations for the year ahead.
1. The S&P 500 after Back-to-Back 20%+ Years
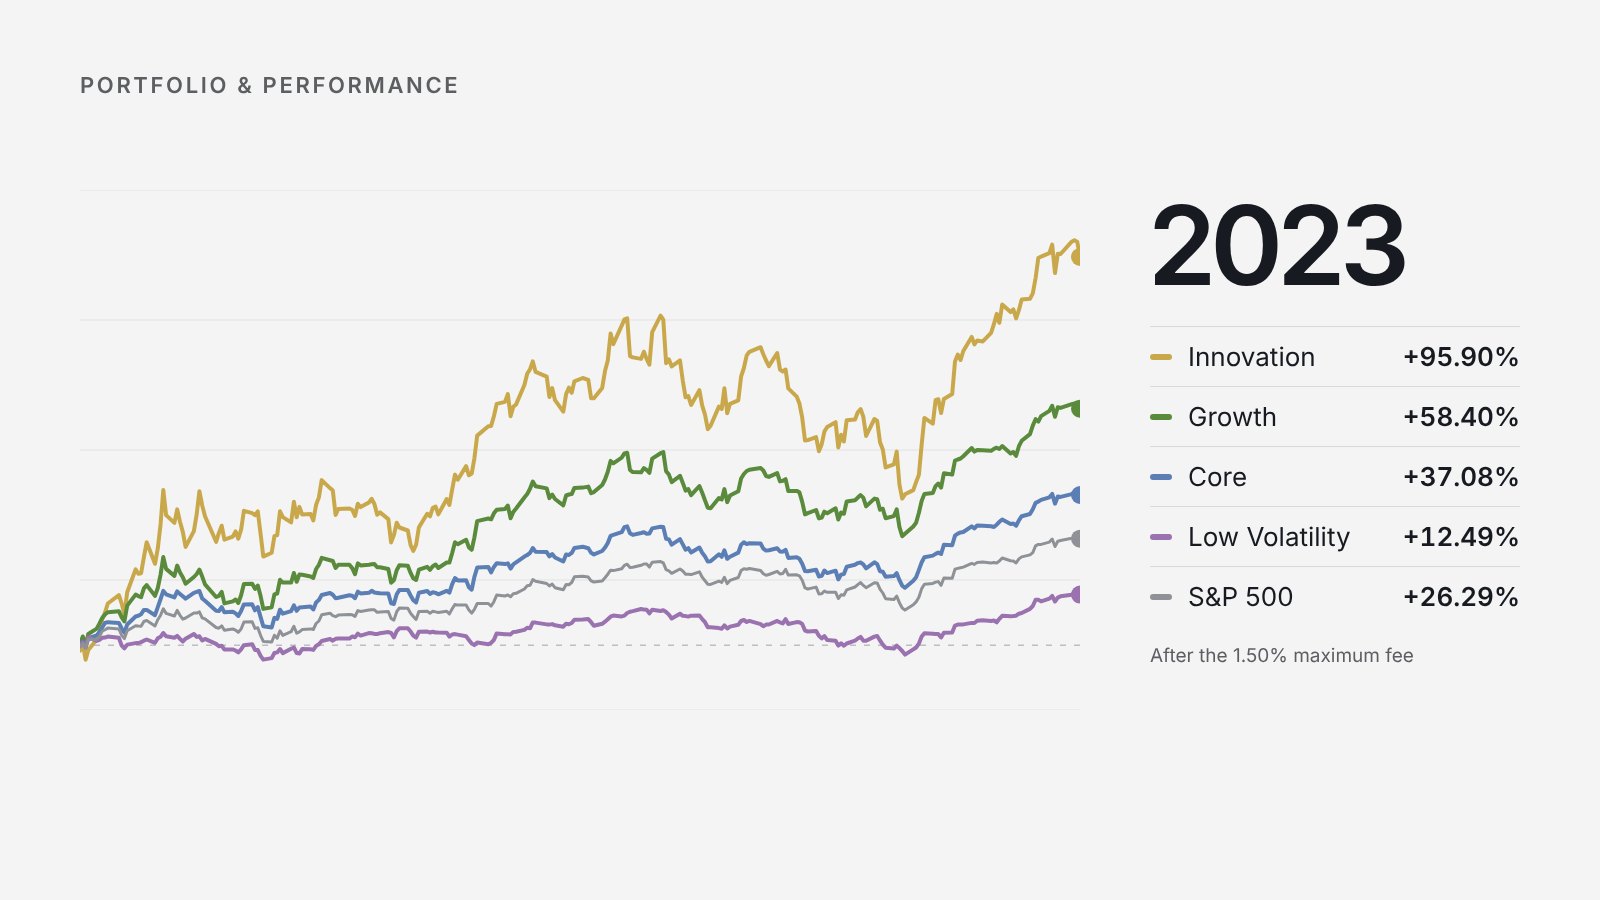
The S&P 500 has posted back-to-back 20%+ returns, gaining approximately 26.3% in 2023 and 25% in 2024. Historically, this has only occurred 14 times since 1926. One year after such streaks, the index has been positive 63.64% of the time, with a median return of 6.56% and an average return of 6.75%. Some of the most notable instances were in 1997, 1998, and 1999—three exceptional years leading up to the peak of the tech bubble. Given this historical context, the data suggests continued gains are likely, but after two strong years, it’s reasonable to expect more moderate returns rather than another round of high double-digit performance.
| Year | Annual return |
|---|---|
| 1997 | 33.36% |
| 1998 | 28.58% |
| 1999 | 21.04% |
| 1944 | 19.75% |
| 1952 | 18.37% |
| 1956 | 6.56% |
| 1984 | 6.27% |
| 1977 | −7.18% |
| 1929 | −8.42% |
| 2000 | −9.10% |
| 1937 | −35.03% |
2. The S&P 500 After Closing the Year with a PE Ratio Over 28
Another way I'm analyzing the market for 2025 is by looking at P/E ratios. The Fed is set to lower rates slightly this year—though not as much as previously expected—but still moving in a dovish direction. However, P/E ratios remain elevated, and while that can be a concern, historical data suggests that high P/E ratios sometimes precede exceptionally strong years. This was the case in 2002, 2008, and 2020, where elevated valuations were followed by significant gains. 2020 stands out as a prime example, with P/E ratios climbing to nearly 40. If an investor had waited for valuations to drop back to 25 before buying, they would have ended up purchasing at the 2021 peak, only to endure the 2022 bear market. This underscores the challenge of timing P/E ratios—while low valuations present a clear buying opportunity, high P/E ratios don’t necessarily signal an imminent decline. Instead, they indicate a market where immediate buying urgency is lower, but strong returns are still possible. Historically, when the market closes a year with a P/E ratio above 28, the following year has been positive 66.67% of the time, with a median return of 23.75% and an average return of 12.28%. The table below highlights these historical returns.
| Year the P/E closed above 28 | Next year's return |
|---|---|
| 2020 | 28.71% |
| 2002 | 28.68% |
| 2008 | 26.46% |
| 1998 | 21.04% |
| 1999 | −9.10% |
| 2001 | −22.10% |
3. The Big Picture: What to Expect for the S&P 500’s 2025 Target Price Using Fundamentals
The most effective way to project full-year returns for the S&P 500 in 2025 is by applying an appropriate P/E ratio to expected earnings per share (EPS). The stock market ultimately moves based on earnings growth, and for 2024, the actual EPS for the S&P 500 came in at $240.36 per share. Looking ahead, analysts consolidated by FactSet project that earnings will grow to $275.24 per share by the end of 2025. This means that if we can determine a reasonable P/E multiple to apply to these earnings, we can estimate where the index should trade by year-end. Historically, the most effective way to determine an appropriate P/E ratio has been by looking at the 10-year Treasury yield, which has an extremely strong inverse correlation with equity valuations.
Looking ahead, analysts consolidated by FactSet project that earnings will grow to $275.24 per share by the end of 2025.
Since 2002, the 10-year Treasury yield has, on average, been about 0.4% higher than the federal funds rate. With the Fed expected to lower rates to 3.9% by the end of 2025, this suggests a 10-year yield of approximately 4.05%. In order to determine the appropriate P/E ratio, or what “multiple” to pay for 2025 earnings by the end of the year, we use a widely accepted valuation method: taking 100 and dividing it by the 10-year yield. Using this formula: 100 / 4.05 = 24.65. Below is a historical chart of the S&P 500 P/E ratio.
This gives us an estimated P/E ratio of 24.65, which we can apply to projected 2025 S&P 500 earnings per share (EPS) of $275.24.
Multiplying these values: 275.24 × 24.65 = 6,784.66.
This results in a year-end S&P 500 price target of 6,784.66. Given the current index level of 6,066, this implies an 11.87% upside from today’s price. Additionally, compared to the starting index level of 5,881 at the beginning of 2025, this projects a 15.35% full-year return. While returns may moderate from the past two years of strong performance, the data suggests another positive year ahead, with our base case price target of 6,784 for the S&P 500 by the end of 2025.
2025 Return Projection for Our Innovation Portfolio
Our Innovation Portfolio returned 98.4% in 2023 and 39.3% in 2024 (gross of fees). This translates to a total cumulative return of 218.4% from the beginning of 2023 to today. Unlike traditional equity strategies where P/E ratios are a primary valuation metric, our Innovation Portfolio invests in high-growth companies that may not yet be profitable due to continuous reinvestment in expansion. Because of this, Price-to-Sales (P/S) ratios are a more appropriate measure for valuation.
To estimate the portfolio’s potential return, we analyze the historical P/S multiples of the BVP Emerging Cloud Index (EMCLOUD), which serves as a benchmark for high-growth technology stocks. Historically, since 2015, the average P/S multiple in the high-growth innovation sector has been around 10x.
However, despite our Innovation Portfolio’s outstanding 218.4% return since the start of 2023, overall valuations have remained historically low, sitting at just 6.3x today. What makes this so compelling is that, despite these significant recent gains, there is still substantial room for valuation expansion. The market hasn’t seen the type of multiple expansion typically associated with a high-growth bull market, which means the gains we’ve seen so far have been driven almost entirely by earnings growth rather than valuation expansion.
This disconnect is exactly why 2025 presents such a significant opportunity. High growth stocks have remained undervalued relative to historical trends, largely due to the effects of elevated interest rates and risk-off sentiment over the past two years. But as interest rates decline, investor risk appetite returns, and capital begins rotating back into high-growth sectors, the conditions are set for a long-overdue valuation expansion. Given these factors, we expect P/S multiples to expand to 8x by the end of 2025, representing a 26.98% increase in valuations.
Our Innovation Portfolio is built around companies with strong revenue growth projections, and current estimates indicate an expected 27.95% revenue growth over the next 12 months (based on a blended median and mean growth rate for our portfolio companies). Using this data, our total return projection for 2025 is straightforward:
- Revenue Growth Projection: +27.95%
- Valuation Expansion Projection: +26.98% (P/S multiple rising from 6.3x to 8x)
- Total Return Expectation for 2025: (1.2795 × 1.2698) = 62.47%
This means that, based on our current projections, our Innovation Portfolio is expected to deliver a 62.47% total return over the next 12 months. Translating this to a return from today’s closing price, we anticipate an approximate additional 55.59% return by the end of 2025.
For additional context, our Innovation Portfolio has already started 2025 with a strong 15.8% gain, outperforming the S&P 500 and Nasdaq, which have returned only 3.3% and 3.5% year-to-date. Given that valuation expansion has yet to fully materialize, the sector remains extremely attractive. With continued strength in growth sectors, favorable macroeconomic conditions, and multiple catalysts for valuation expansion, we expect another exceptional year ahead for our Equity Innovation Portfolio.
The Bottom line?
Looking back at the last two years, our Equity Innovation Portfolio delivered a 98.4% return in 2023 and 39.3% in 2024 gross of fees, amounting to a cumulative return of 218.4% since December 30, 2022.
Based on our analysis, we anticipate another strong year in 2025, with expected returns of approximately 62.47%, driven by revenue growth and valuation expansion in high-growth technology sectors. Our other portfolios—Equity Growth +38.77%, Equity Core +35.96%, and Equity Low Volatility +18.19%—also met or exceeded expectations in 2024, reinforcing our commitment to delivering superior risk-adjusted returns.
As we move forward, we are excited about our new partnership with Wendroff & Associates, an Arlington-based CPA firm specializing in advanced tax and accounting strategies. We’ll be sharing more details soon on how their expertise can support your financial planning. Additionally, if you need estate planning guidance, we work closely with your estate attorney so your estate plan and your portfolio fit together.
If you’d like to discuss your portfolio or financial strategy for 2025, click the link below to schedule a time to speak with Chris Passarelli. We look forward to another incredible year and appreciate your trust in Bull Run Investment Management. Here's to a successful 2025!