
BRIM 2021 Year End Market Recap
Our look back at 2021 across markets and our portfolios, and what we expected next.
Bull Run Investment Management
2021 Year End Review.
Broad Market Recap 2021:
2021 last year marked one of the best years for value, cyclical, and defensive stocks in the past 2 decades. Notable value sectors such as Energy (XLE) and Financials (XLF)were up 44% and 30% respectively for 2021, while the United States Commodity Benchmark(GSCI) was up 36% for the year. The majority of the expansion we have seen in the share prices in these groups of stocks are the result of expanding valuations, not expanding earnings. Historically bank and energy stocks (among other similar value sectors) trade around 10x earnings. The reason for this is because banks have tons of regulations, credit risk, and limitations that altogether limit their growth potential. Energy stocks have low price to earnings multiples (P/E) because oil, shale, and natural gas is a dying industry that very likely won’t be around in the next 20 to 30 years when renewable energy solves the world’s problems with limited access to raw materials and pollution. Over the past 18 months or so, we have seen valuations in these stocks expand from 10x earnings to current levels between 15x and 22x earnings. In fact, right now many of these stocks are hitting record highs in valuation – which has helped increase the valuation of the overall market as well. On the other hand, stocks that historically trade above average 20x price to earnings multiple of the S&P 500 include internet software, entertainment software, application software, semiconductors and non-bank financial services, which typically trade at PE’s of around 35x to 45x. The reason for their above average multiple is due to higher than average net and gross margins (helps retain profitability during recessions), and their higher than average earnings growth rate due to secular long term growth trends in their industries. There is another element of management that plays into valuations as well. Typically, you find some of the most intelligent and brightest minds in today’s world (or at any point in history) find themselves at the forefront of innovation, they are the ones who take responsibility and action, and they are the ones who make their vision to pioneer and change the world for better into a reality. These inventors and entrepreneurs quite publicly display their vision and tenacity to innovate and grow, commanding a higher P/E ratio than companies with bad management teams. Today, nearly all of the top 10 Ivy League graduates are going to work for the best companies in Cloud Software and Computing, Machine Learning, Fintech, E-Commerce, AI and Blockchain, etc.
In the paragraph above I mentioned how value stocks have just seen the largest expansion in multiples in the past two decades. Recently expanding multiples in value stocks have risen as much as 80% or more, while price to earnings multiples in other areas of the market have expanded around 20%. Earnings on the S&P 500 have only gone up about 15% since January 2020, while the index itself has seen a 45% rally since then, hitting recent all time highs. The reason theS&P 500 is up 45% since then is not because the 500 companies are making 45% more money (they are only making 15% more) but because investors are simply willing to pay more for those earnings. The price to earnings ratio is used to calculate the value of the S&P 500. It’s the multiple that people are willing to pay based on how much the index has earned per share. For example, the S&P 500 is earning about $162 per share as of today, multiply that by 29 and you get $4,968 per share – several points off the index’sclosing value of $4,677 today. As I mentioned above, the S&P historically trades at 20x earnings on average. Had we been trading at our historical average of 20x right now – the index would only be worth 3,240. This is why P/Eis so important – it’s exactly what determines the price of the Index. As you may know, timing what this number will be at any given point in time is very difficult to do. Another important valuation metric to look at is the “Price to Sales” ratio (P/S). This valuation metric is required to analyze fast growing businesses like Amazon or Netflix. For well over a decade, both of these companies were losing money quarter after quarter, year after year, generating negative earnings. So – what do you value a company like that at, $0? Of course not, so instead of valuing the company on earnings, investors instead value the company on total sales(revenue). For example, a company with $1 Billion in annual sales trading at a price to sales ratio of 3 has a market cap of $3 Billion dollars. Another way of saying this is, “The company trades at 3 times sales”, instead of “The company trades at 20 times earnings”.
Below is a snapshot of the following for the S&P 500: (1) the P/Eratio (price to earnings),(2) the EPS(earnings per share), and next page (3) the P/S ratio(price to sales) going all the way back to 1880. As you can see, the market has never been this expensive before aside from elevated levels after the 2000recession and 2008 recession in order to price in future earnings upon the economic recovery (see pullback in earnings on graph 2). Meaning in 2008, when the P/E went above 65, it was because investors knew there would be a2-3x increase in earnings over the next year (see chart 2 - 2008). Currently, there is not going to be an increase in earnings of that magnitude over the next year. Wall street estimates earnings to grow by only 9% in 2022. The reason I bring up this discussion on multiples is to show you what’s going on with multiple expansion in the market. Sure it does look scary, but statistics show after years like we had this year, history points to another great year of double digit-gains for the market. Take a look at 2003, where the P/E spiked to almost 45. Buying the S&P at that time would have produced a 6x return on investment as of today, just over 10% annualized.
What we find fascinating about the market's movements is the concern of rising interest rates and inflation, which began in February of last year. In most cases, the market responds to these anxieties by compressing rather than extending its multiple (see early 1980s). Given the nearly 50% increase in the Price to Earnings ratio, and an even greater increase in the Price to Sales ratio to record levels, we find it fascinating that the market essentially singled out our stocks and went after high-quality growth stocks, while expanding valuations in every other area of the market during "fear of rising inflation." This (the gap) does not make sense to us (or many other skilled investors).
For more information on this for those interested in later readings, see here.
We strongly believe in the companies we own in our Growth Portfolio. The particular ones we own are the highest quality and are at the forefront of innovation. They are involved in the fastest growing secular trends the economy will experience over the next decade. They are run by some of the most professional management teams on Main Street. They continue to prove their expansion and growth quarter after quarter posting mind-blowingrevenue growth rates well beyond every single company in the S&P 500 index over the past 5 years. They have incredible economic moats and durable competitive advantage, producing Gross and Net margins higher than every industry on the planet.
We have seen multiples in our part of the market collapse anywhere from 50% to 90% from their all-time highs during a period of growing valuations throughout the wider market to record levels. While this is true in general, it is not true for all growth companies, such as NVDA, AMZN, GOOG, and FB. When it comes to the ones that have plunged to the levels mentioned above, we haven't seen values this low since the Tech Bubble. The difference between now and then is that the firms in which we have invested have nearly doubled their revenue since the beginning of 2021, avoiding the calamity that occurred during the Tech Bubble crash. Furthermore, our businesses are not insolvent, but rather are seeing rapid revenue growth. Some of our equities have contracted at a faster rate seen during the Tech Bubble, while others have contracted to a lesser degree at a slower rate. However, on average, we are quite close to bottom level valuations seen during the bottom of the Tech Bubble. As a result, we think that right now provides a multi-year opportunity for our growth companies to deliver above-average returns.
(Below – the P/S for the S&P 500breaking out to an all time high – while nearly the opposite has taken place in growth)
To begin with, growth valuations peaked back in February of 2021. As a ballpark estimate, the P/S back during this time for our Growth Portfolio was around 18x sales – definitely above historical averages. Currently right now, the average P/S ratio for our portfolio has dropped to 8.01x, representing a decline of over 50%. Many stocks we own now that have gone public after the tech bubble are trading at historical all time low valuations. On the next page you will find some information showing the breakdown of P/S multiples by industry along with Gross Profit Margins.
Valuation Metrics:
Above is a screenshot from an interactive web program I use to analyze different profitability metrics by industry. On the top left you can see Profitability Margins for all 7,247 publicly traded companies (not just the S&P 500) in the U.S. The average Gross Margin for all of these companies is 37%, while the average Net Profit Margin is 8%. On the bottom left I used the dropdown box to showcase the Software(Internet) Industry, which consists of 305 companies. I had to scroll all the way to the top on the right to display the industries we have exposure to, which are the ones I’ve highlighted. The Software (Internet) industry shown has Gross Margins of 67% and Net Margins of 24%. Gross margins are vital in determining net profit margins in companies at terminal growth. In the case I've shown, and in most other industries we're exposed to, Net Profit Margins are roughly 1/3 of Gross Profit Margins. So, in this case, a 24% Profit Margin is just over 1/3 of the industry's 67% Gross Margin (Software – Internet). These companies often operate on subscription models, host ads, charge platform fees, etc., all of which lead to very low fixed infrastructure costs and physical footprint, leading to very high improvements in bottom line margins. Down from #1 Tobacco, is #2 Financial Services (Non-Bank). Non-bank financial services include credit card processing and payment companies like MasterCard, Visa and PayPal as well as Fintech firms such as Square. Noting from the chart above, non-bank financial services firms have even higher net margins (26%) vs (Software –Internet) net margins of 24%. These two industries I’ve showcased are 3x more profitable than the market average of 8%. This image is significant because it depicts the mar ket's average Gross Margins and the industries where our growth stocks excel. It also shows the average ratio of Gross Profit Margin to Net Profit Margin (1/3) for the industries highlighted above.
Below is a table from excel showing (1) The average Gross Profit Margin for the stocks in our Growth Portfolio(2) The average estimated future Net Income Margin for the stocks in our Growth Portfolio (3) The average P/S ratio for our portfolio, (4) The average P/Sratio for the industries the stocks in our portfolio belong to (highlighted in yellow). Lastly, at the bottom, I’ve added in our portfolios expected sales growth (direct from Schwab) of 77% annually. For this analysis we should analyze the entire growth Portfolio (the averages) as if it were just one stock. Looking at the numbers, we can see the portfolio is producing, today, gross margins of 59% – well above the 38% average for the market. Using the rule of (1/3) we looked at earlier, we can now estimate what Net Income Margin our portfolio will produce upon reaching terminal growth, which comes out to a 19%Net Income Margin. This is well above the market average of 8%. Looking at the list on the right-hand side of the screenshot, We can see what the averageP/S our industries are valued at, which turns out to be well above the 3xmultiple for the S&P 500. Because these companies are (1) much more profitable than average, and (2) have higher P/E ratios in the 35x to 45x range, they are among the highest P/S industries in the market. You can see #1Financial Svc’s (our FinTech’s), where the Industry has an average P/S Ratio ofa whopping 31.49. #2, Software and internet stocks, have a P/S Ratio of 15.67,Semiconductors at 7.16, etc. If you take the average of all 5 highlighted groups, it comes out to an average P/S Ratio of 14.86x. I mentioned at the bottom of page 3 in this newsletter that at the beginning of this year in February, our portfolio was trading at almost an 18x average P/S Ratio – above averages. Currently, as you can see in the bottom left, our left, our P/S Ratio as of today is sitting at just 8.0x. These numbers were calculated roughly one week ago, as of January 5ths 2022 close, this number is closer 7.2x).
Now we have a lot of information to work with. If we know the average P/E ratio our portfolio should have upon terminal growth, along with the Net Income Margin our portfolio will be producing, then we can come up with some exact figures on market capitalization numbers at various points in the future. We can also do some easy math to see what the P/S Ratio will wind up at as well.
To make sure we are all on the same page – I would like to quickly explain why and how the terminal P/SRatio for our portfolio should be 6x or higher. For easy math purposes, let’sassume at terminal growth, the Growth Portfolio will have an average Net Income Margin of 20% (rounded from 19%). Our portfolio should trade at an industry average P/E Ratio of 35x upon terminal growth – but to be conservative – we will assume our high quality, well above average margin portfolio trades instead at the S&P 500 market multiple of 30x. So our two variables are (1)20% Net Income Margin and (2) 30x P/E Ratio.
All we have to do now is select any amount of Revenue for the portfolio, let’s use $1 billion dollars in annual sales for simple math purposes. Now we have as follows: $1 Billion in Sales * 20% Net Income Margin = $200 million dollars in Net Income. Step 2:$200 million dollars in Net Income * 30 (P/E Ratio) = a Market Cap of $6 billion dollars.
Lastly, we can now take the $6 billion dollar Market Cap and divide it by $1 Billion in Sales to calculate what the P/S Ratio of the portfolio will be upon reaching terminal growth – which comes out to 6x P/S. To determine this number at terminal growth, the two dependent variables are Net Income Margin and P/ERatio. For example, if margins were 30% instead of 20%, then the portfolio’s average P/S would be 9x, instead of 6x.
We strongly believe in these numbers. Our most profitable companies already have Net Income Margins at 50% and higher. In addition, we expect further improvement in Gross Margins beyond current levels. Lastly, we expect our portfolio to trade in line with industry average multiples, above the average for S&P 500.
To provide just a bit more info on P/E’s before so we can wrap up and move into the fun, I’ve attached 4 graphs as of today of P/E ratios in the sectors we talked about. (Take an average of both lines to get a good sense of the current P/E).
Fundamentals
Below is my favorite part of this newsletter, and contains two screenshots from excel: (1) Our Expected Annualized Return as of February 2021, when our portfolio was at 18x P/S, and(2) Our Expected Annualized Return as of Today, when our portfolio is currently at 8.0x P/S.
The two tables below contain simple values to work with for our Growth Portfolio for the purpose of projecting share price growth based on the metrics we outlined and discussed above. The columns contain Revenue (in Billions), P/S Ratios, and Market Cap (based on the P/S Ratio). The rows contain years, with “Today” being the starting point. In Year 1, Revenue is assumed to grow at 70%, declining 10% sequentially each year until hitting its terminal growth rate of 15% in year 7– following the trajectory of typical innovative growth companies and trends. (Please note – the table shows all 10 years of projections, but the chart displays only the first 5 years)
In the table below (February 2021 Projections),you can see beginning revenues of $1 Billion starting “Today”, a P/S multiple of 18x, giving us a simulated market cap of “$18 Billion”. This Market Cap is essentially the initial investment value, or cost, for the portfolio. At the beginning of last year 2021, we expected that value would grow from $18 to $22,representing about a 22% annual return for the year. Obviously, we underestimated contractions in multiples and ended the year slightly in the red. You can see on the bottom left in bold, 3 different timeframes showcased for annualized returns projected at this time – 3, 5, and 10 Years. Given the conditions present at the time, over the next 3 years we expected to generate annualized returns of 26.83% based on these projections. This works out to exactly a 100% return over the 3 year period – doubling the portfolios value. Over the Next 5 years we expected our portfolio would annualize 23.63%,just under tripling in value, generating a 5 year total return of 188%.You can see the 10-Year expected annualized return at the time of 17.91%.
Notice how over time, theP/S multiple (in Orange) falls rapidly from 18 in the beginning until it begins to slow down towards year 3 and eventually peters out to 7 in year 5?Meanwhile, revenues (in Blue) have grown from $1B to $7.4B over the same 5 year period that the multiple was being compressed. This increase in revenue well offsets the 60% decline in valuation over the period, leading to positive returns. Finally, (in Grey) is the Market Cap for each year. It’s interesting to see how it reflects the relationship between the two variables, and provides a good depiction of what it’s like behind the scenes when investing in strong growth stocks.
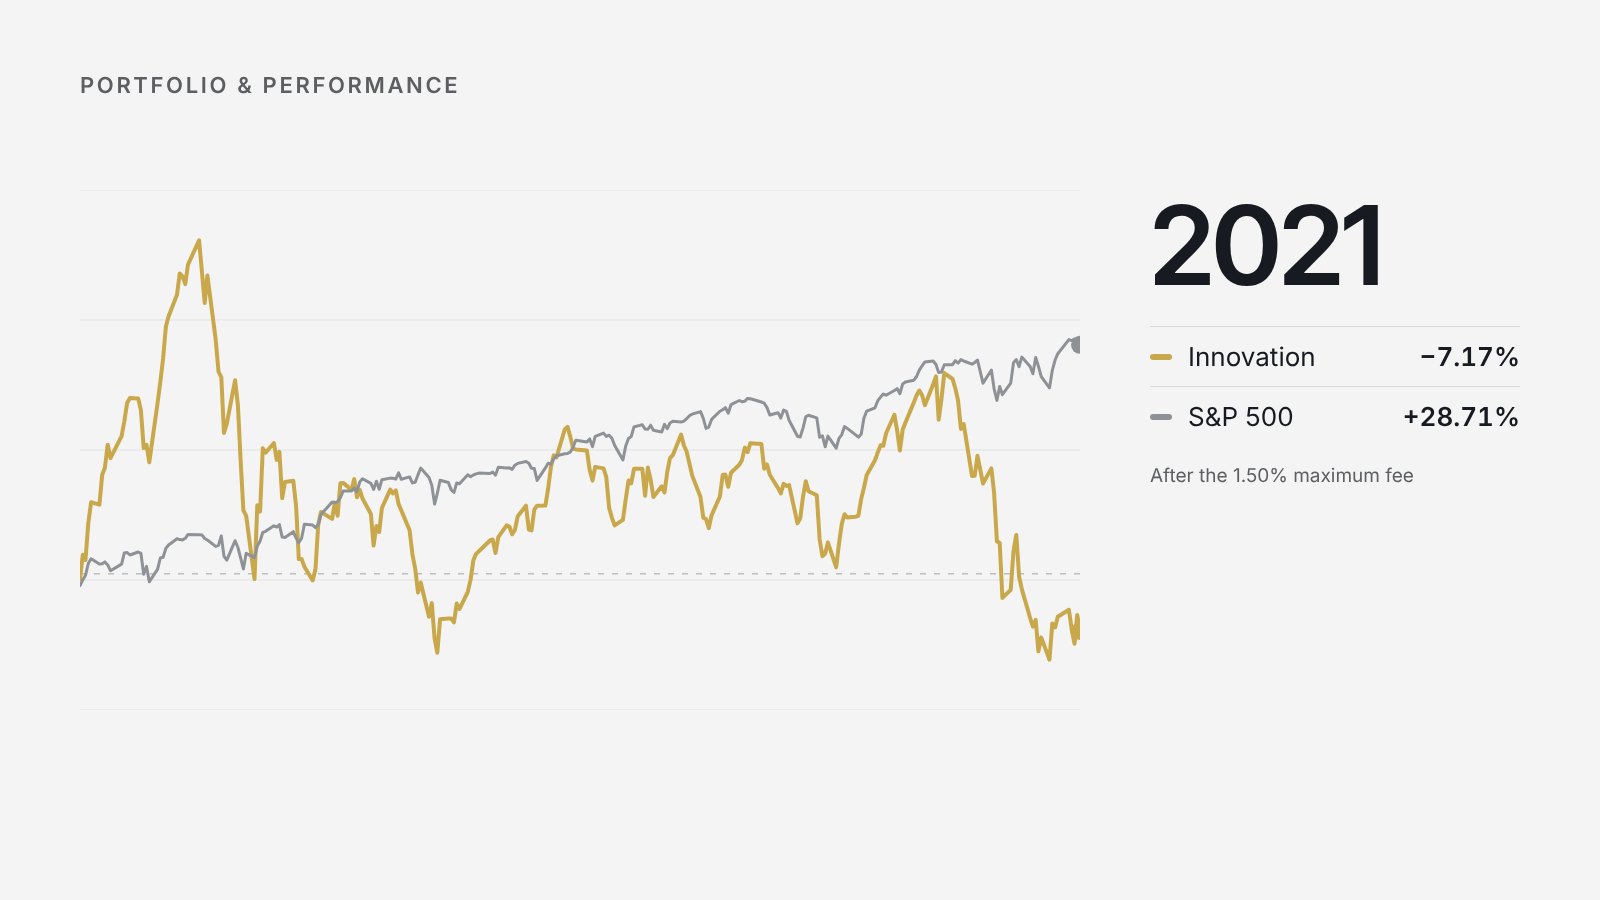
At the beginning of February2021 (Graph 1 above), our Growth Portfolio was in a very similar standpoint as it is today with respect to interest rates, revenue growth, and margin growth. Today, our average sales growth rate is about the same as where it was in February. At the beginning of last year we expected fabulous revenue growth (which happened)but also expected a severe decline in valuation. We were expecting a decline in valuation to the tune of 30% by the end of the full year. This happened, but toa tune significantly more substantial than we expected – where we witnessed almost a 60% decline in valuation. Combining these 2 factors together, they canceled each other out a bit and we wound up closing the year 2021 down-7.20%.
Below is the same table as above, except with updated numbers for the start of Today (January 2022Projections). Year 1 reflects the start of 2023. I mentioned earlier in this letter, our sales growth estimated by Schwab was 77.71% as of yesterday, Jan 5th 2022. In this example, we use the same logic with 70% initial growth, aswell as the same sequential declines. Notice though – the price to sales ratio– that’s much different. Instead of starting this year at 18x like we did last year, we are starting this year at a very comfortable 8x. Given the same expectations in growth, and the proven ability to generate such growth as demonstrated fundamentally over the last year, given our current and future margins expectations remain relatively the same – we expect this year and the next several year to offer substantially above average returns for the growth segment of the market, particularly the stocks we hold in our Growth Portfolio.
Looking at the P/S column year by year, we are not projecting a drastic 60% decline by the start of 2022 like we experienced last year. (It’s actually possible valuations could potentially pop this year given the large decline last year). However, sticking to our guns as always we like to plan for the average of history to repeat itself over time, and therefore we are expecting a small decline next year to 7.8x sales, declining by 0.2 each year until it ends at 6 in year 10.
Given the conditions today, we are now expecting over the next 3 years to potentially generate annualized returns of 55.69%based on these projections. This works out to a 270% return over the next 3 year period – over tripling the portfolio’s value from where it is today. Over the Next 5 years, these projections imply a 45.39%annualized return, and 27.87% annualized return over the next 10 years. Cathie Wood, who runs a more aggressive, early growth stage portfolio, ARKK, is the #7 ETF over the last 5 years, annualizing some 37% over the period. She is regarded as one of the most successful investors of all time. Recently in mid December, she came out and made similar comments on her portfolio as to her expectations now versus in February. She publicly said in December that she expects a quintupling in her portfolio over the next 5 years, representing a 40% annualized return. These expectations above are simplybased on projections. If these projections do happen, we willreceive these results. If these projections fall significantly short and we only obtain half of the returns noted above – we would still be greatly satisfied with those returns.
Based on where we are starting from today, we are starting the year with a massive increase in margin of safety as compared to last year. Even if valuations get slashed by 30% this year – (we don’t think they will be) – we would still be likely to close out the year with over a 20% gain given the massive increase in revenues that will be generated over the next 12 months. Instead however, we are expecting, truly, one of the best 3 to 5 year investment horizons for these groups of stocks in avery long time. Throughout 2010 and 2020, these secular growth trends were only being developed, during that time these businesses still offered the best returns across the market up until today. Over the next decade into 2030 – we and other professionals are expecting these trends to only accelerate upon themselves. The advancements in infrastructure, computing, growth in 3rdworld countries, are all allowing these industries to flourish and develop themselves into some of the most powerful and innovative businesses the world has ever seen.
The advancements in computing power we are seeing in the chip industry(particularly by Nvidia) are growing so fast to the point where we have recently broken Moore’s Law several years ago. Computing power for artificial intelligence increased 300,000x between 2012 and 2018. By using AI in synergy with GPUs, many of the top semiconductor companies are now growing faster than was ever thought possible. Within the next 2 to 3 years we are expected to unveil the world’s first fully functional quantum computer, operating at 0° Kelvin. Using these technologies will lead to new S curves building upon new S curves, and will lead to new industries that were only thought possible in science fiction – such as the metaverse, breakthroughs in genetic engineering, driverless cars, etc.
Technicals
I’d like to provide a bit of Technical analysis and review of last year 2021 in the disruptiveinnovation/growth area of the market, which is best to compare our growth portfolio to. While we’re not happy with our -7.2% return for last year, we are quite proud that it fared far better than our competitors in this space. Nearly every ETF in this segment of the market realized double digit declines for the full year, all of which underperformed our portfolio substantially in 2021. Below is Full Year 2021 Performance for the S&P, ARKK, TAN, IBUY, WCLD, and FINX.Akkk = Disruptive Innovation, Tan = Solar Energy, Ibuy = Online Retail, Wcld =Cloud Software and Computing, Finx = Fintech. (blue arrow points to returns)
In 2021, out of all of high growth/innovation ETF’slisted above, the only one that outperformed our portfolio last year was WCLD –with a -3.21% return. ARKK, the #7th best fund out of all 1600+ equity ETF’s over the past 5 years (as of this writing) closed the year down -24.02%, while the other ETF’s representing our exposure closed the year in the -20% range as well. Last year we increased the active management side of the portfolio heading into late spring up until November, this helped us generate alpha with shorter term trades and positioning, buffering a lot of the downside we experienced in our longer term, core positions. Moving into the first quarter of 2022, we’re quite pleased with our current positioning and don’t believe such levels of shorter term trading seen during the mid-half of last year will be required to outperform the market heading into the first quarter of this year. Please take note of the chart on the right (linked above), which shows the top 10 Funds over the past 5 years, ALL of which are growth ETF’s. Over the past 1-Year, the average return for this group is just about flat.
Wrapping up with technicals, I’d like to share the chart above as I believe this picture is worth a thousand words. In the bottom right hand of the screenshot you will see -37.67% in black, which is ARK’s 1-year return as of January6th, 2022. The darker blue line on the bottom is known as “ROC”, or“Rate of Change” and displays on any given day, ARK’s 252-trading day return,(or 1-year return for simpler language). See at the beginning of 2021 how this number hit a shocking some 220% return – over just 1 year. Notice the orange vertical lines on the chart. Remember how I said ARK’s 1-year return as of today’s close is -37.67%? Well – that has never happened in the entire history of this fund dating back to 2014. On March 18th, the bottom of the Coronavirus pandemic, ARK’s 1-year return bottomed at -26.16%. During the beginning of 2016, when the market was on the verge of entering an earnings and manufacturing recession, ARK’s 1-year return bottomed at -29.43%. If you zoom in and zero in on the numbers, and then project 252-days later after these events occurred, you would be pleased to find some impressive numbers. Buying at the lows in February of 2016 would have generated a return of 53%over the next 12 months. Buying at the lows in March of 2020 would have generated a return of 246% over the next 12 months. On average, buying ARK after these 2 events and holding for the next 12 months would have produced an average return of 149.5% over the next year. Are we saying to expect a150% rally in our growth fund next year? Of course not. Is it in the realm of historical probabilities? Of course. As we all know, past performance is not indicative of future results. However, analyzing history and paying attention to extreme events on either side of the market, and analyzing outcomes based on those events can give us a clue of what’s more likely than not to expect in the future.
Hedge Funds
You may be wondering what the smartest Portfolio Managers on the planet are doing in their portfolios. From publicly accessible Hedgefollow.com, I’ve added a screenshot of the Top 20 hedge funds over the past 3 years by annualized returns. Keep in mind – hedge funds don’t subscribe to any particular strategy – they can practically buy anything under the sun. Some are Long-only, Some are Long/Short Managers, some are Macro Managers, some are Quant Managers, Some are Options and Arbitrage Managers, etc. No matter the Managers style though, they have a large amount of leniency in their holdings month by month. Nearly all top hedge fund managers over this period who generated such outsized returns in their portfolios happened to beLong-only managers that did so by owning the same stocks we own in our Growth Portfolio. Unfortunately, you can’t copy these Portfolio Managers every day. These positions are reported at the end of every quarter, but you need to wait 45 days after the end of the quarter for that info to be released – and then another 45 days after that to get the next report (that will be 45 days old). I highlighted Jorge Paulo’s portfolio below (36.32% annualized for 3 years straight – pretty good). Take a look at some of his top holdings. 45% is in CVNA, SE, and SQ… talk about volatile, but not too shabby with those returns. I encourage you to visit thiswebsite and check out what some of these Portfolio Managers are holding. Most are in the same positions we’re in. Our annualized return since inception is well in line with the list below. In fact, the #1manager on the list has 96% of his portfolio in Sea Ltd (NYSE:SE), a stock in our Growth Portfolio.
To wrap up the discussion on these Top 20 Hedge Fund Manager’s positions, I’d like to provide Wall Street Analyst’s 12 Month price target for every position we hold in our Growth Portfolio. Looking at these price targets and seeing the distance current levels are from Analyst’s targets can help provide some understanding (including other reasons) as to why all of these managers are holding these positions right now.
To put all of this in perspective – the average price target set by Wall Street Analysts for theS&P 500 – is right around 10% (give or take a percentage point or two). I will reiterate – Around 20% to 30% upside in a portfolio of stocks like this isa relatively normal target set by Wall Street year after year. As I’ve mentioned, I have never seen such targets remotely this high before, and is likely one reason so many Hedge Fund Managers are loading up on them right now.
Interest Rates
There has been so much fear and discussion of inflation and interest rates in the stock market over the past 18 months, and the fear has persisted albeit without any negative impacts to the market (aside of course from the attack on growth we talked about in page 2). I would like everyone to understand some basic relationships between how interest rates affect the stock market and how they impact the present value of future cash flows.
I’d like to start with a quote from Warren Buffet, “For inflation acts as a gigantic corporate tapeworm. That tapeworm preemptively consumes its requisite daily diet of investment dollars regardless of the health of the host organism. Whatever the level of reported profits (even if nil), more dollars for receivables, inventory and fixed assets are continuously required by the business in order to merely match the unit volume of the previous year. The less prosperous the enterprise, the greater the proportion of available sustenance claimed by the tapeworm”.
And one more from Warren, “Companies that, through design or accident, have purchased only businesses that are particularly well adapted to an inflationary environment. Such favored business must have two characteristics: (1) an ability to increase prices rather easily (even when product demand is flat and capacity is not fully utilized) without fear of significant loss of either market share or unit volume, and (2) an ability to accommodate large dollar volume increases in business (often produced more by inflation than by real growth) with only minor additional investment of capital. Managers of ordinary ability, focusing solely on acquisition possibilities meeting these tests, have achieved excellent results in recent decades. However, very few enterprises possess both characteristics, and competition to buy those that do has now become fierce to the point of being self-defeating.”
What Buffet is saying in the first quote is that regardless of the level of operating profits a business produces, inflation affects all businesses equally. More is required of every business to match the same standards they did last year in unit volume. It may look like the business is doing ok by reporting increased sales for example, but behind the scenes they could be withering away or under pressure and actually selling less units and producing less than they were the year prior – even though it may look better on paper. He finished by saying the poorer the business is with respect to growth and future prosperity – the moreinflation will hurt that business.
In his second quote, Warren is simply declaring in the first sentence that some Companies are (by accident or not) simply operating a business (or multiple business arms) that fare particularly well against the headwind of inflation. He goes on to say thebest two qualities a business can have to fight inflation is (1) an economic moat and pricing power, and (2) easy and rapid ability to scale revenue growth without high increases in variable costs.
It’s the case that our Growth Portfolio very well encompasses these traits that Warren listed in the second quote, and surely avoids factors he listed in his first quote.
When inflation picks up, interest rates tend to pick up as well. When this happens after a period of calm for a long time, it can cause a large spike of volatility in the stock market. There are different reactions every time. Last year the reaction was from a scare in “unprofitable” growth companies and a flocking towards“value” stocks. Was this move based on logic by discounting the future cashflows of all business over the next 5, 10, 20 years? No, it was not based on that. I can spend the next 3 pages going into the math on this but I’m pretty sure most readers would rather be spared of that. What it came down to was the fact that value was simply underperforming (awfully) the broad market, not just growth, over the past 15 or so years. Last year’s inflation and interest rate woes, along with a rapidly changing and fragile economy, were enough catalysts for people to change their outlook on cash flow generation from the next 3 to 5years or so to the very next year. Now, if the market decides over several months to change its investment cash flow discounting outlook to all the sudden the next 1 year instead of the next 5 years, then yes – these growth stocks willlook expensive and “overvalued” if the market is now only valuing and discounting the next 1 years cash flow instead of the next 5 to 10 years. This causes a lot of short term volatility but does not affect longterm growth, margins, or multiples. However – interest rates (not inflation), no doubt do those effect multiples.
Interest Rates – Part 2
Below is a long term chart of (1) The10-Year Government Note Yield in Blue, (2) The Federal Funds Rate (FFR) in Red, and (3) Inflation in Purple. (This purple line as of today is currently around 5%). The FFR is an interest rate set by the Federal Reserve that determines the level of interest rate banks charge on loans to each other to meet regulatory cash reserve requirements. This FFR plays an enormous role acting as a benchmark, or magnate for global interest rates. Particularly in the U.S. – theFFR and the 10-Year Treasury Note yield have very high correlation with each other. Specifically – the red line controls where the blue line is going, and inflation follows the trend. For example, the massive boom in commodities led to a big surge in inflation in the 70’s and 80’s. The Fed was raising the FFR along the whole way in order to combat this rise in inflation as best as possible. When inflation calmed down by the early 80’s, the fed eased on the gas pedal and began lowering rates – effectively bringing down the 10 year yield with it – as you can see inflation follows. This period was a short exception from the majority of history when inflation is not going gangbusters. Right now, is one of those more normal periods where inflation is steadily tracking the FFR. Ultimately, when the Fed comes out to talk, all they talk about is inflation, and what they are going to do with their monetary toolbox to keep it under control. The Fed has notified Wall Street that by the end of 2022 – they are targeting a FFR of between 0.75% and 1.25%.Expectations from Wall Street on the 10-Year Yield is about 2.2%. Currently, we are at 1.5%. Year end inflation targets for 2022 are 3.8%.
For 2022 – if the market does begin to suffer on a P/E basis and the ratio drops below 30, the market can still close the year in positive territory depending on the growth of earnings for the year. While we expect the P/E ratio to remain steady this year, a decline is possible. However, such a decline in the PE would likely be in the wake of advancing earnings.
Part of the reason I believe the S&P 500 will be able to hold a 30x P/E is due to the direction outlined by the Fed. Below is a chart showing the Federal Funds Rate over the past 10 years. As I mentioned above, the Fed has targeted an FFR of between 0.75% and 1.25% by the end of 2022. We just discussed how important this rate is in impacting interest rates and inflation, so it’s helpful to zoom in and focus on the volatility of this metric over the past 10 years to understand how it moves. (The black line is volume on FFR Futures Contracts that came out in 2016 – you can ignore that). The bottom line here – is that interest rates are the real burden to market valuations, and also play a huge role in how fast companies can grow via the cost of money to borrow and fund growth. The cheaper interest rates are, the more money companies can borrow nearly for free. This turns out to be highly beneficial to aggressive growth companies.
Newsletter Recap:
To summarize, inflation has peaked in 2021 and we have been seeing declines in readings heading into this year. Inflation will likely not be a big factor of market discussion beyond the first quarter of this year. Interest rates are expected to be rising slowly to moderately by the end of the year, but are not projected to grow much beyond that and will remain below long term averages over the next 12 months. While multiples have hit record highs in recent months across broad markets, this is likely sustainable given negative real yields on bonds as investors have limited options to generate positive real returns.
To summarize, for the next upcoming year 2022, we are expecting a large return to Growth segments of the overall market, with the largest upside being in Small Cap and Mid Cap Growth. Large Cap Growth should produce on average normal annual returns for this year. We see Large Cap Value (like the positions in our Low Volatility Portfolio) to perform well in 2022 as well, with an expected return in the 8 - 13% range for this market segment. With Small and Mid Cap Value, we are somewhat pessimistic on many of these names in the financial and energy sectors, and are expecting a -6 to -12% decline in this segment of the market. We expect an average to slightly below average year for the Small and Mid Cap Core segment of the market, and an average year for Large Cap Core. Asa result, we will execute some minor rebalancing shifts in the Core portfolio through the first quarter of this year in order to gain better exposure to Small and Mid Cap core positions that present greater upside for this year. We are expecting a return in our Core Portfolio between the 7% - 12% range for this year. With respect to our Growth Portfolio, we are expecting a return of 25% for this year. The newsletter shows our true mathematical projections, and the returns (ARK included) this segment of the market has seen over the next year given this technical set up. We looked at fundamental and multiple projections, we looked at the average distance from price targets, and we looked at holdings from the top hedge fund managers. All of this data strongly suggests that we could potentially see an incredible year in this area of the market for 2022.As financial advisors, not hedge fund managers or salesman, we’d like to under-promise and over-deliver for our clients this year.
DISCLOSURE:
Bull Run Investment Management is a registered investment advisor. Information presented herein is for educational purposes only and does not intend to make an offer or solicitation for the sale or purchase of any specific securities, investments, or investment strategies. Investments involve risk and unless otherwise stated, are not guaranteed.
Readers of the information contained on this performance sheet, should be aware that any action taken by the viewer/reader based on this information is taken at their own risk. This information does not address individual situations and should not be construed or viewed as any type of individual or group recommendation. Be sure to first consult with a qualified financial adviser, tax professional, and/or legal counsel before implementing any securities, investments, or investment strategies discussed.
Portfolio performance is shown net of the advisory fees of 1.65%, the highest fee charged by Bull Run Investment Management and sample trading costs based on our Custodian’s Charles Schwab’s trading costs. Performance does not reflect the deduction of other fees or expenses, including but not limited to brokerage fees, custodial fees and fees and expenses charged by mutual funds and other investment companies. Performance results shown include the reinvestment of dividends and interest on cash balances where applicable. The data used to calculate the portfolio performance was obtained from sources deemed reliable and then organized and presented by Bull Run Investment Management.
The performance calculations have not been audited by any third party. Actual performance of client portfolios may differ materially due to the timing related to additional client deposits or withdrawals and the actual deployment and investment of a client portfolio, the length of time various positions are held, the client’sobjectives and restrictions, and fees and expenses incurred by any specific individual portfolio.
Return Comparison: TheS&P 500 was chosen for comparison as it is generally well recognized as an indicator or representation of the stock market in general and includes a cross section of equity holdings.
PAST PERFORMANCE IS NOGUARANTEE OF FUTURE RESULTS
OUTSIDE CITATIONS IN ORDER OF APPEARANCE:
https://www.multpl.com/s-p-500-pe-ratio
https://www.multpl.com/s-p-500-earnings
https://www.multpl.com/s-p-500-price-to-sales
https://app.powerbi.com/view?r=eyJrIjoiNjY1MGQwNDktY2Y2Ni00ODNiLWI0ZDItYjI0ZWQ2MTg2NjJlIiwidCI6ImVkZmYzMjg1LTk5NGYtNGE1ZC1hNjYxLWRkMTRjMmY1YTU4NSIsImMiOjF9
https://pages.stern.nyu.edu/~adamodar/New_Home_Page/datafile/pedata.html
https://www.gurufocus.com/sector_shiller_pe.php
https://www.tradingview.com/chart/ARKK/fjtB7ME4-S-P-500-vs-ARKK-TAN-IBUY-WCLD-FINX/
https://etfdb.com/screener/#page=1&tab=returns&sort_by=five_ytd&sort
https://etfdb.com/screener/#page=1&tab=returns&sort_by=five_ytd&sort_direction=desc&asset_class=equity&leveraged=false
https://hedgefollow.com/top-hedge-funds.php
https://fred.stlouisfed.org/graph/?g=KBQF