
How Government Shutdowns Affect Markets and the Economy
Shutdowns make headlines, but they have had little lasting effect on markets. What the record shows.
Washington is back in the headlines as the federal government faces a shutdown if policymakers can't reach a new funding agreement. This adds to a year in which government policies around trade, taxes, immigration, and more have created uncertainty for the economy and markets.
For investors, it's natural to wonder how politics might affect their portfolios, especially for those concerned about the size of the budget deficit and national debt. Understanding the historical patterns, and why markets generally look past them, can help investors maintain perspective during periods of political gridlock.
Political drama in Washington can create uncertainty, but history shows that government shutdowns typically have limited impact on financial markets. While the toll that shutdowns have on government workers can be real, their effect on financial markets has historically been minimal. For long-term investors, these episodes highlight the need to separate political views from financial plans. This is especially important when daily headlines focus on controversial topics that have not historically affected portfolios.
Looking ahead, our view is that a government shutdown — whether it happens or not — is more of a headline event than a market event. We may see a brief window of volatility, but history shows these periods are quickly shrugged off, and we believe the more likely outcome is a strong rally once the uncertainty clears. In fact, we think the timing is constructive: if a shutdown comes in October, the volatility should be very brief, and by November with the headlines behind us, markets will be set up well into year-end. In our eyes, the market remains positioned for growth, with innovation and high-growth sectors continuing to drive the upside.
Government shutdowns have not historically affected markets or the economy
On an annual basis, the federal government must pass a budget for the next fiscal year, which begins on October 1. While the government passed the “One Big Beautiful Bill Act” earlier this year that lays out tax and spending policies, a budget is needed to allocate the actual dollars to different departments and agencies. Failure to do so by the deadline means that the government might face a shutdown, resulting in a lapse in government services and employees being furloughed.
It's rare for Congress to pass budget bills on time. This may not be surprising given the increasingly polarized political environment in Washington, where compromise has become more difficult to achieve. Over nearly fifty years, Congress has managed to pass appropriations bills before the fiscal year deadline only a few times, making last-minute negotiations the norm rather than the exception. One solution that Congress has used often is known as a “continuing resolution” which temporarily funds the government while lawmakers negotiate. Republicans are currently proposing a seven-week stopgap bill for this purpose.
As the accompanying chart shows, government shutdowns have occurred regularly since 1980 under presidents of both parties, with minimal long-term impact on financial markets. The chart illustrates that this was true even during the most contentious shutdowns, including during the Reagan administration, Clinton's 21-day shutdown in 1995, Obama's 16-day shutdown in 2013, and Trump's 35-day shutdown in late 2018 to early 2019 - the longest on record. For investors, shutdowns have generally served as temporary disruptions rather than fundamental threats to economic growth.
Shutdowns reflect deeper political differences
The current situation reflects disagreements over spending priorities, primarily around healthcare. While the immediate funding of the government is the focus, these budget battles reflect deeper differences around the role of government and fiscal responsibility. With federal debt now around 120% of GDP, many agree on the need for fiscal discipline but there is fundamental disagreement as to how this should occur.
What makes this situation unique is the administration's directive for agencies to prepare permanent workforce reduction plans beyond typical temporary furloughs. This represents a departure from previous shutdown patterns and could create longer-lasting impacts on the job market and fiscal spending. Note that furloughed federal workers do automatically receive back pay once the shutdown ends, a policy that was enacted as part of the negotiations that ended the 2018 to 2019 shutdown.
For some investors, the threat of a government shutdown may blend in with other fiscal issues such as the debt ceiling. The debt ceiling becomes a problem when spending the government has already approved needs to be paid for, but the Treasury Department isn’t authorized to borrow above a certain limit. The only solution in these cases is for Congress to raise the debt limit, or else the government risks defaulting on its obligations. All of these fiscal challenges are one reason the major credit rating agencies have downgraded the U.S. debt below AAA. Fortunately, the One Big Beautiful Bill Act also raised the debt ceiling by $5 trillion, so this problem can be avoided for some time.
Markets focus on fundamentals, not political headlines
So, while many investors have concerns over the fiscal trajectory of the country, government shutdowns have generally been uneventful for financial markets. The reason is straightforward: shutdowns are temporary disruptions that don't change underlying economic fundamentals.
Shutdowns can affect economic data reporting, which may temporarily affect important data used by investors and economists such as the Bureau of Labor Statistics’ jobs report and Consumer Price Index. However, this typically only delays the data, with reporting resuming once the shutdown ends. They can also create modest headwinds for economic growth if they last long enough, as federal workers delay spending and government services are disrupted.
As the Economic Policy Uncertainty chart above demonstrates, tariffs and taxes earlier this year created significant challenges for investors. However, with recent clarity around both issues, this measure has fallen toward the longer run average. While a shutdown could always result in greater uncertainty, history shows that even longer government disruptions have not generally impacted investors.
BRIM Portfolio Update – Innovation Spotlight
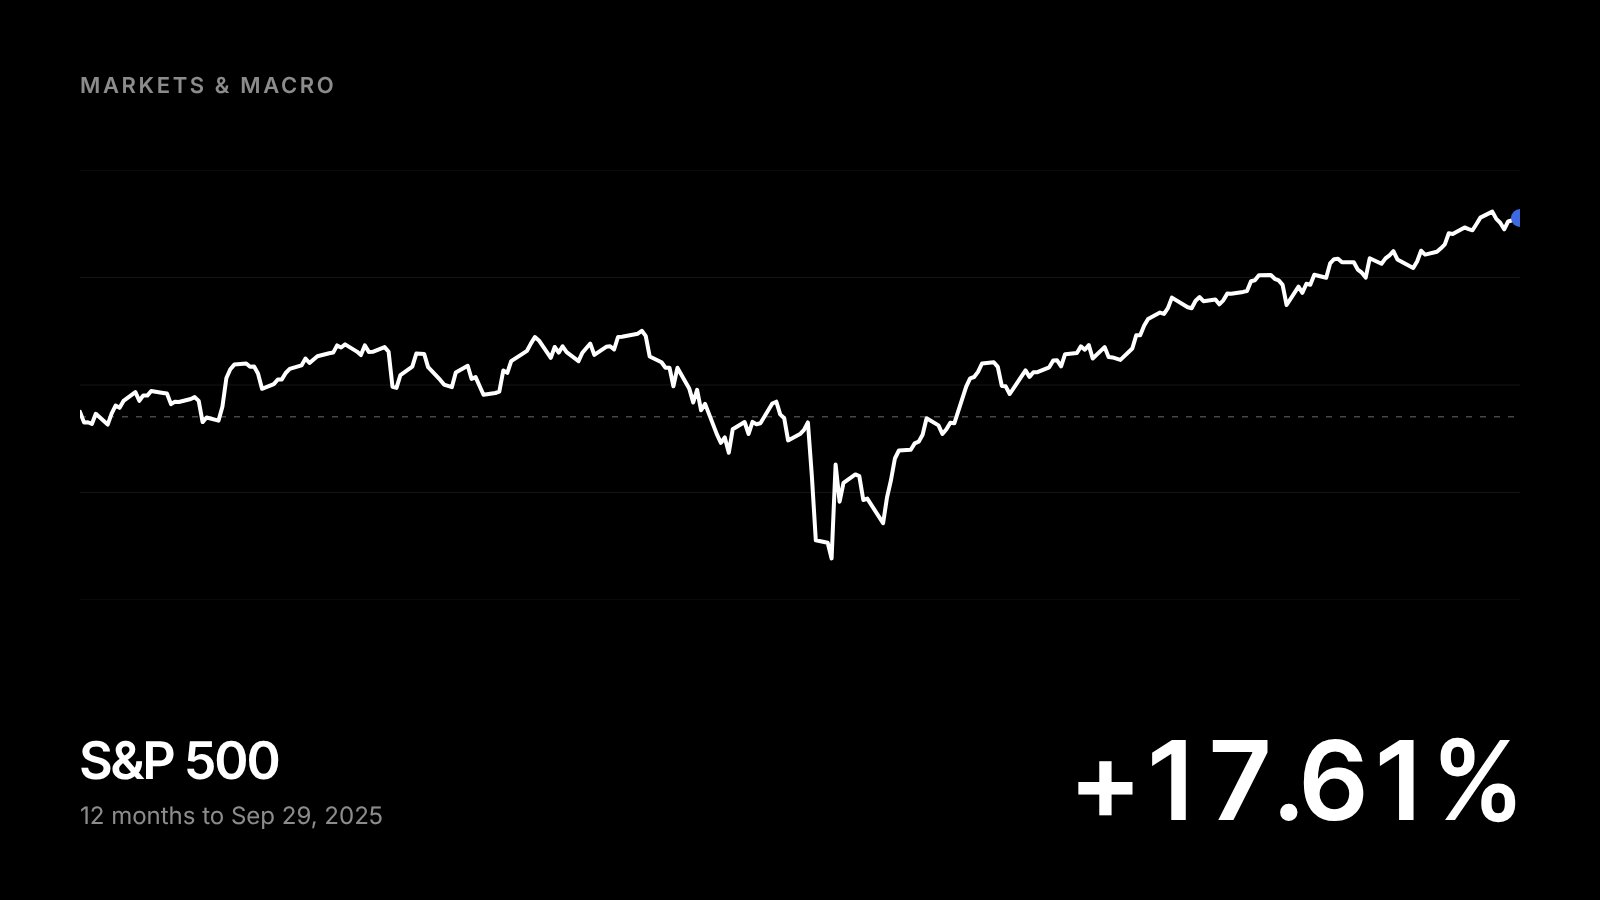
BRIM's Equity Innovation Portfolio is up +58.7% year-to-date through 9/26/25, compared to +14.1% for the S&P 500 and +16.6% for the Nasdaq 100 — over quadruple the S&P 500's return in 2025 so far, (gross of fees).
This is the exact result of the asymmetric upside return we target by owning the top #1 and #2 leaders in sectors like artificial intelligence, cloud infrastructure, cybersecurity, and general tech innovation platforms. Every company in our Innovation Portfolio must project at least 25% annual revenue growth, and with valuations rebounding, forward return potential remains quite strong.
At the same time, our Core and Low Volatility Portfolio's continue to provide steadier compounding, balancing our Innovation Portfolio's high-growth tilt. Together, this structure adds clear long-term value on both absolute and risk-adjusted return bases.
The Bottom Line?
The bottom line? Government shutdowns may dominate headlines, create challenges for federal workers, and disrupt important services, but they have historically had minimal impact on financial markets. For investors in innovation and growth equities, the real story remains long-term compounding driven by the fastest-growing companies in the world, rather then the latest standoff in Washington.