
The Nasdaq 100 Just Got This Oversold: What Happened the Last 31 Times
A Nasdaq-100 momentum signal just turned up from deep oversold. We measured all 31 times it happened since 1999, and what came next.
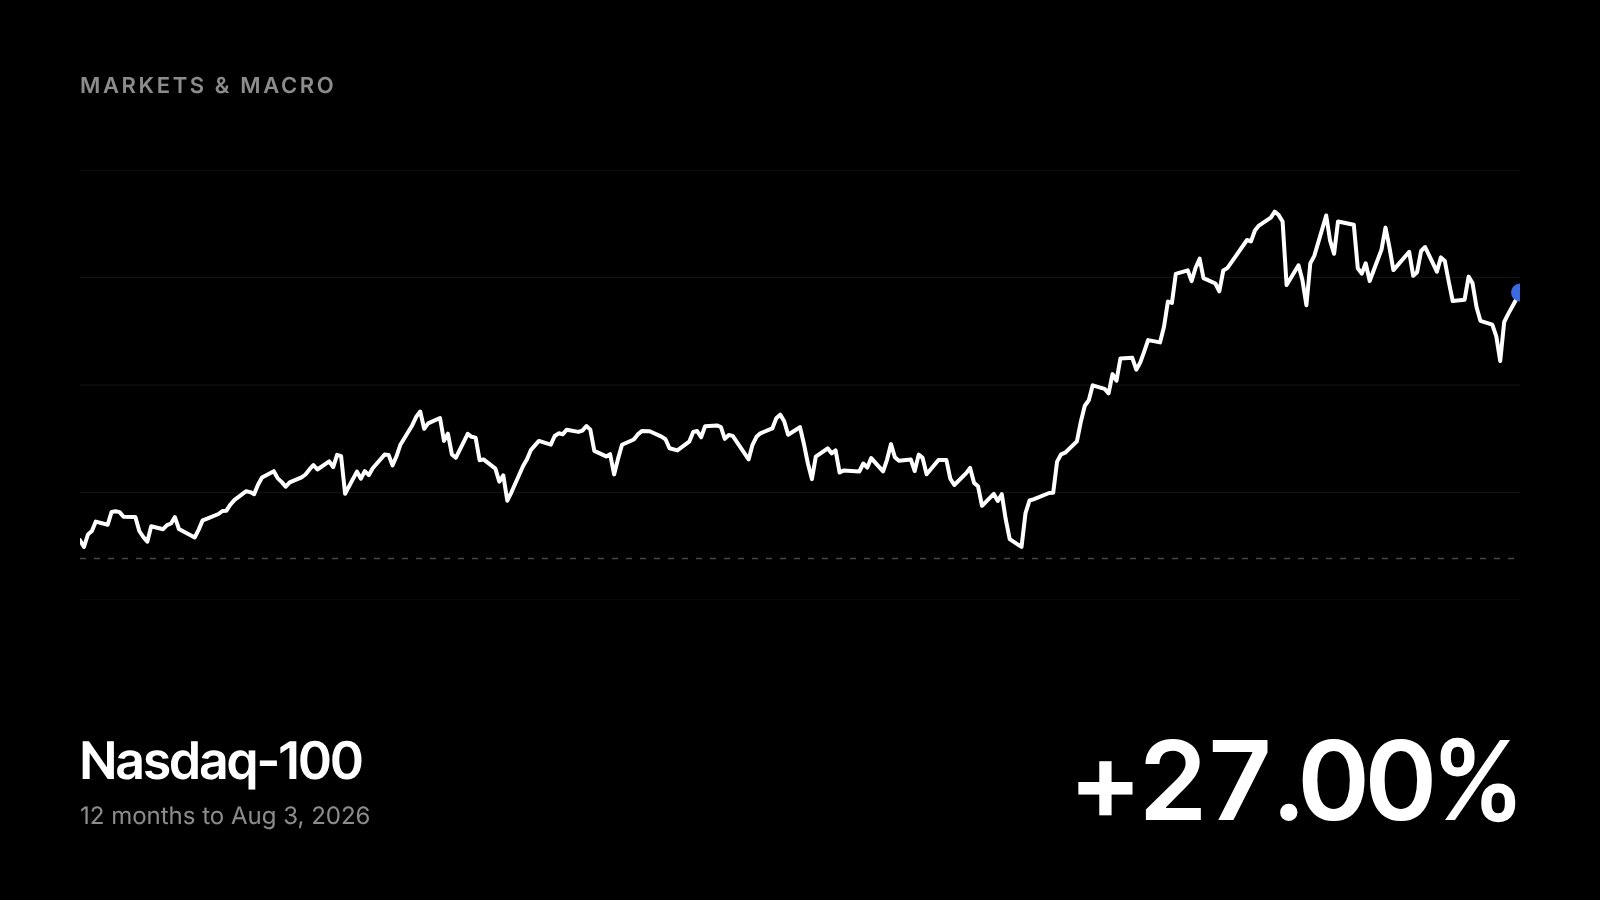
A momentum indicator on the Nasdaq‑100 dropped into deep oversold territory and turned back up on Friday. It is the kind of chart that gets screenshotted with an arrow on it. I went back to March 1999 and measured all thirty-one times it has happened — and the answer is not the one being shared.
Every few months a chart goes around. Same shape, same excitement, same implied promise: this thing has never been wrong. Last week it was the WaveTrend oscillator on the Nasdaq‑100, and clients started sending it to me on Friday afternoon.
It is a fair thing to ask about. So rather than tell you what I think, I did what we do here: I pulled twenty-seven years of daily data, wrote the rule down precisely, and counted.
What actually fired
The WaveTrend oscillator measures how far price has stretched away from its own recent average, then smooths the result. It swings between roughly +60 and −60. When it sinks near −60, sellers have pushed further than they usually manage before something gives.
The rule is simple enough to say in one sentence: the oscillator falls below −60, then climbs back above it. That happened on Friday 31 July. It has now happened thirty-one times since March 1999.
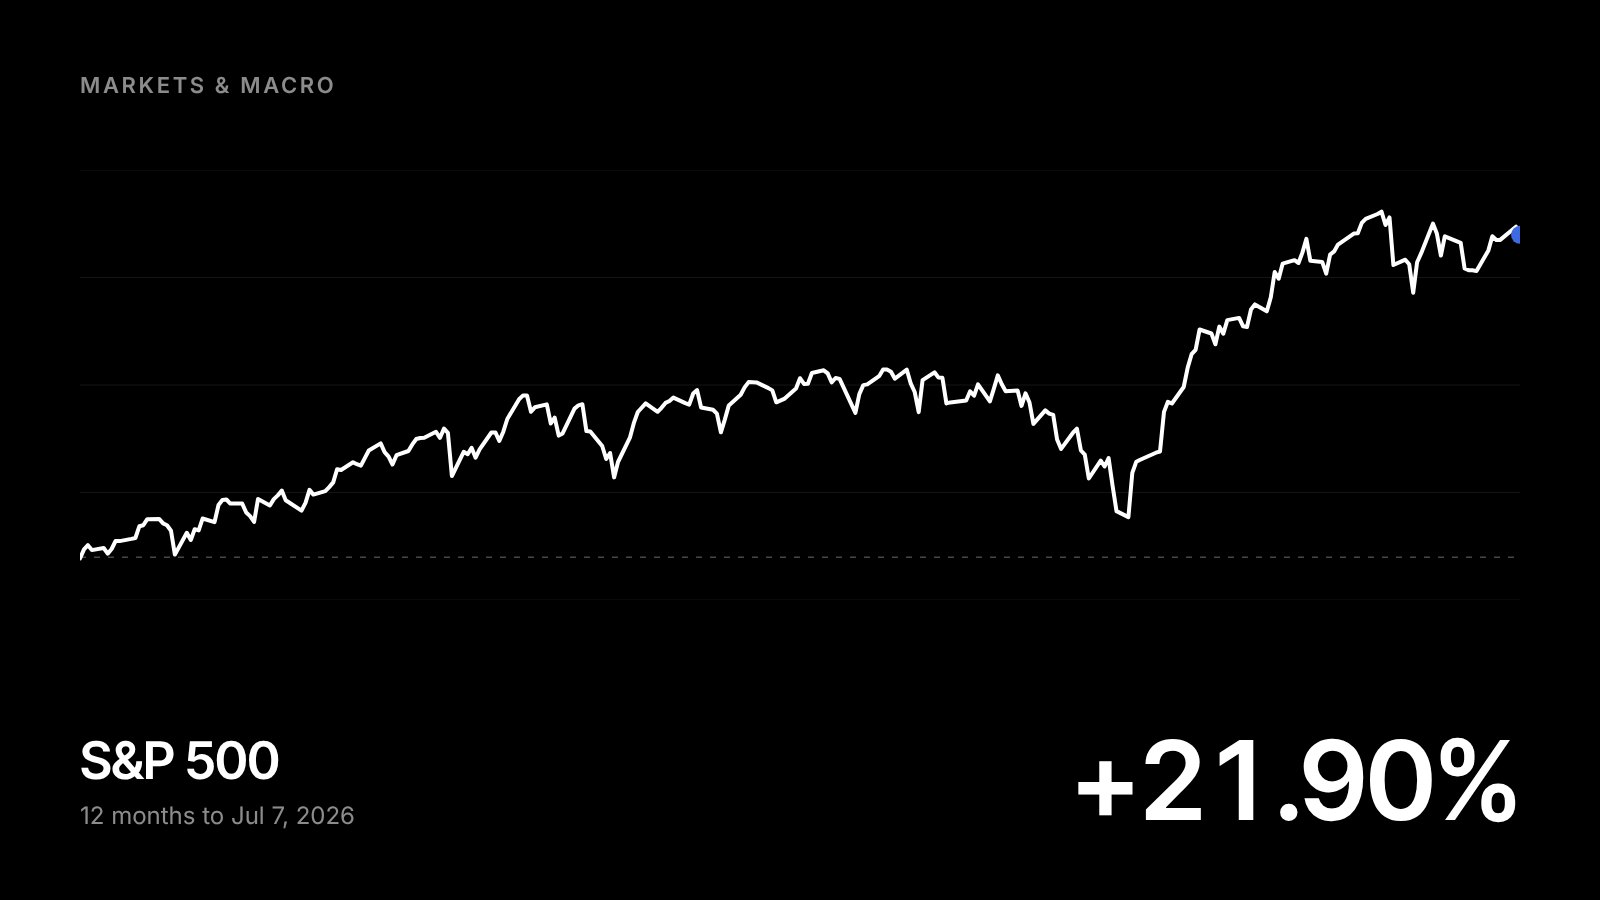
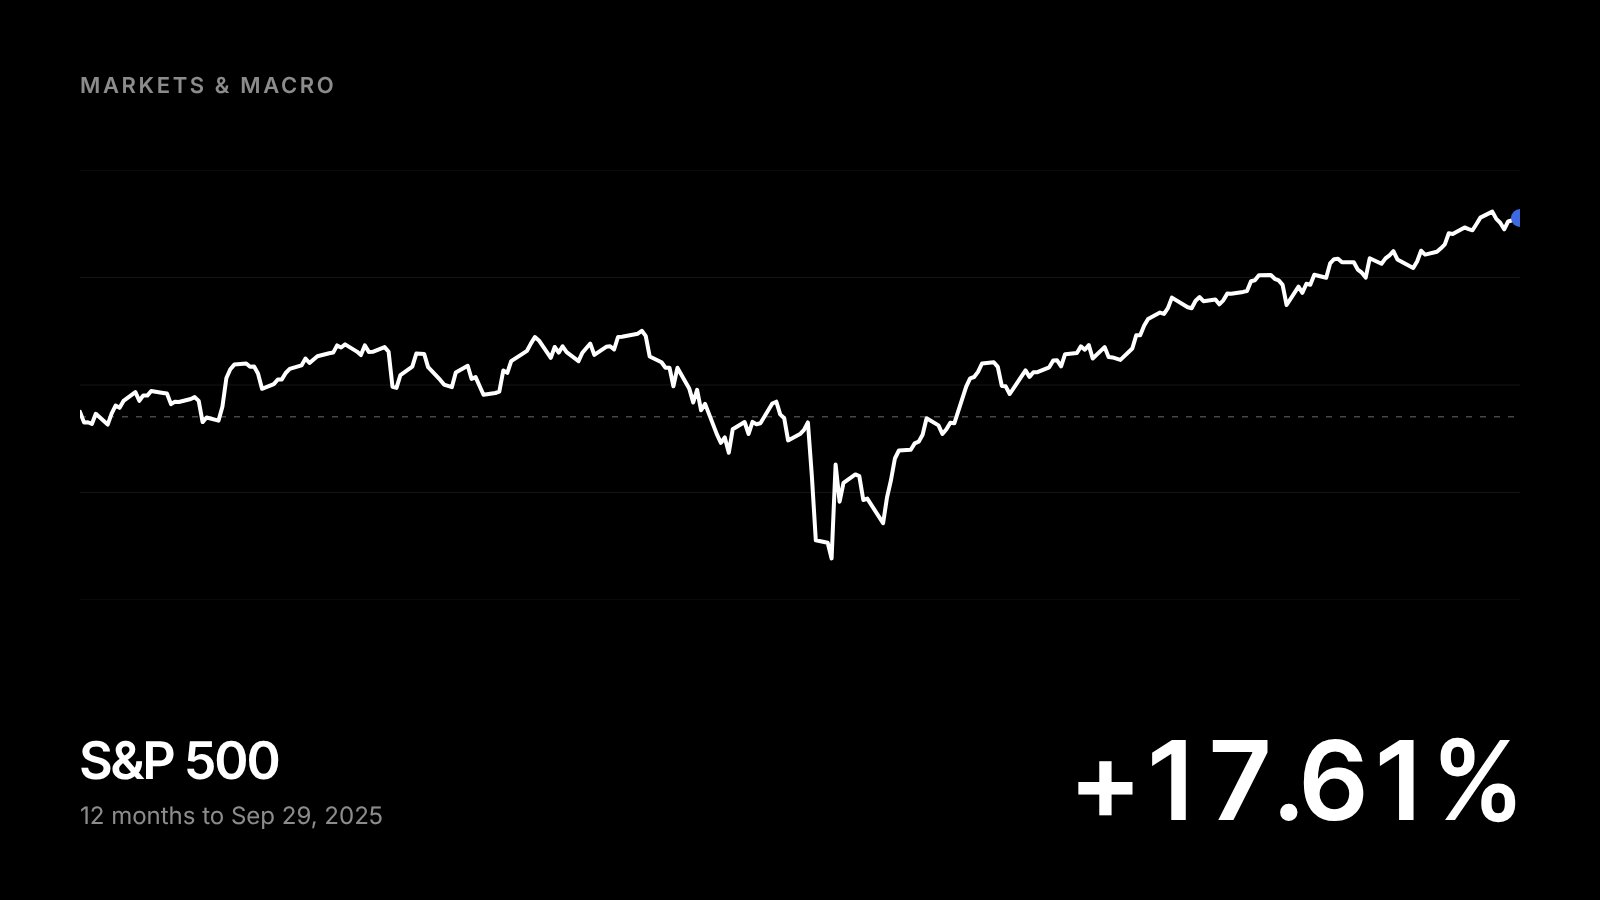
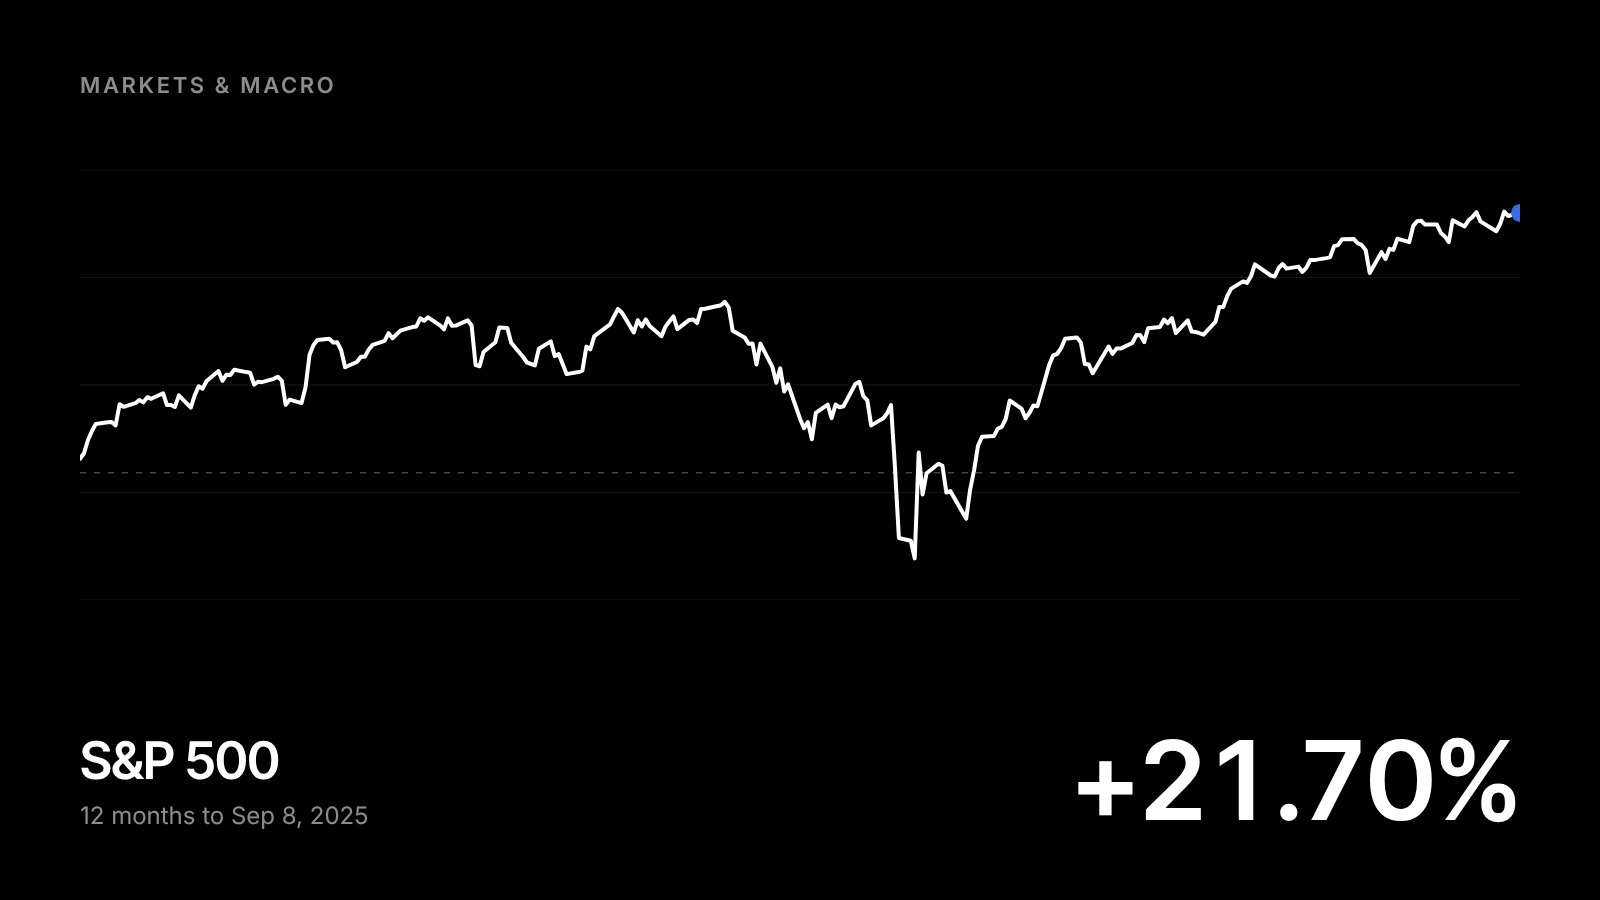
Here is what it looks like across the last four years of the Nasdaq‑100 — three occurrences, including Friday’s.
Source: Tiingo daily prices; Bull Run Investment Management calculations. WaveTrend (10, 21).
All thirty-one, measured
Below is the average return of the Nasdaq‑100 after every one of those thirty-one signals, next to the return from every other trading day across the same twenty-seven years. That second row is the one that matters. A signal is only worth something if it beats simply owning the index and doing nothing.
| Nasdaq‑100, price return | 1 week | 2 weeks | 1 month | 3 months | 6 months | 1 year |
|---|---|---|---|---|---|---|
| After the signal · average | +0.4% | +0.9% | 0.0% | +0.7% | −1.3% | +5.1% |
| Any other day · average | +0.2% | +0.4% | +0.9% | +2.6% | +5.2% | +11.4% |
| After the signal · positive | 57% | 57% | 60% | 53% | 59% | 62% |
| Any other day · positive | 57% | 59% | 62% | 68% | 72% | 78% |
31 occurrences, March 1999 – August 2026. Occurrences within 20 trading days of one another are counted once. Price return, excludes dividends.
Read that twice, because it is the opposite of what the screenshots claim. Over the following year the signal averaged +5.1%. A random day averaged +11.4%. It finished higher 62% of the time against a 78% base rate. At six months it was actually negative while the index averaged +5.2%.
By itself, this indicator has been worse than doing nothing. Not neutral — worse. And that is worth knowing before you act on the next one somebody sends you.
Every loss came from the same place
Averages hide things, so I pulled out the eleven occurrences that lost money over the following year. They were not scattered across twenty-seven years at random. Every one landed in 2000–2002, 2008, or 2022 — three bear markets already well underway by the time the signal fired.
There is a cleaner way to say the same thing. On the day each signal fired, was the index above or below its 200-day average — the simplest measure there is of whether the longer trend is still intact?
Eleven out of eleven. Every loss in twenty-seven years came when the market had already broken its long-term trend. The handful that fired while the trend was still intact were higher a year later every time — though only four of those have a full year behind them, which is far too few to lean on.
So the honest reading is not “this signal predicts big returns.” It is closer to this: the oscillator marks the moment sellers exhaust themselves, and whether that moment turns out to be a bottom or a way station has almost nothing to do with the oscillator and almost everything to do with the trend it fired inside.
Friday’s fired with the Nasdaq‑100 roughly 8.5% above its 200-day average and about 6% below its high. That does not make it a buy signal. It does tell you what kind of decline this has been.
What we are doing about it
Nothing, and I want to be direct about why.
We do not trade client portfolios off oscillators. Our four strategies are built one company at a time on business quality and revenue growth, and a momentum cross on an index does not change what any of those businesses are worth. If I rearranged portfolios every time a chart made the rounds, you would pay for the turnover and I would lose track of what I own.
What a study like this is actually good for is context. Clients have been asking whether this pullback is the start of something worse. The useful answer has nothing to do with the indicator and everything to do with what sits underneath it: the trend has not broken, and this decline resembles the ones that resolved upward rather than the ones that kept going.
That is a reason to stay invested and keep contributing. It is the same thing I would have told you without the chart.