.png)
Chatbots make AI look simple. Underneath sits one of the most complex supply chains ever built — and for investors, understanding its layers matters more than hunting for “the AI stock.”
Your phone is a small miracle you never think about. Behind the glass sits engineering of staggering complexity, and behind that, a global supply chain capable of producing millions of identical devices a year. Artificial intelligence works the same way. Typing a question into a chatbot feels effortless — but that simplicity rests on a full value chain of chips, buildings, power, models, and software that would have read as science fiction a decade ago. That chain has become one of the most important forces driving markets and the economy, and it’s the reason a serious view of AI has to go well beyond a handful of technology stocks.
So let’s walk the chain, layer by layer — with real data at each stop — and finish with how we’re actually positioned for it.
“AI” is a supply chain, not a single stock
The most important insight for investors is that “AI” is not one type of investment. It’s natural to think first of the model providers at the heart of the capabilities — OpenAI, Anthropic, Google, and others — but they are one piece of a much larger puzzle. Around them sits a full supply chain spanning semiconductors, data centers, the models themselves, and the software and businesses that put them to work. Each layer has its own economics, its own business models, and its own risks.
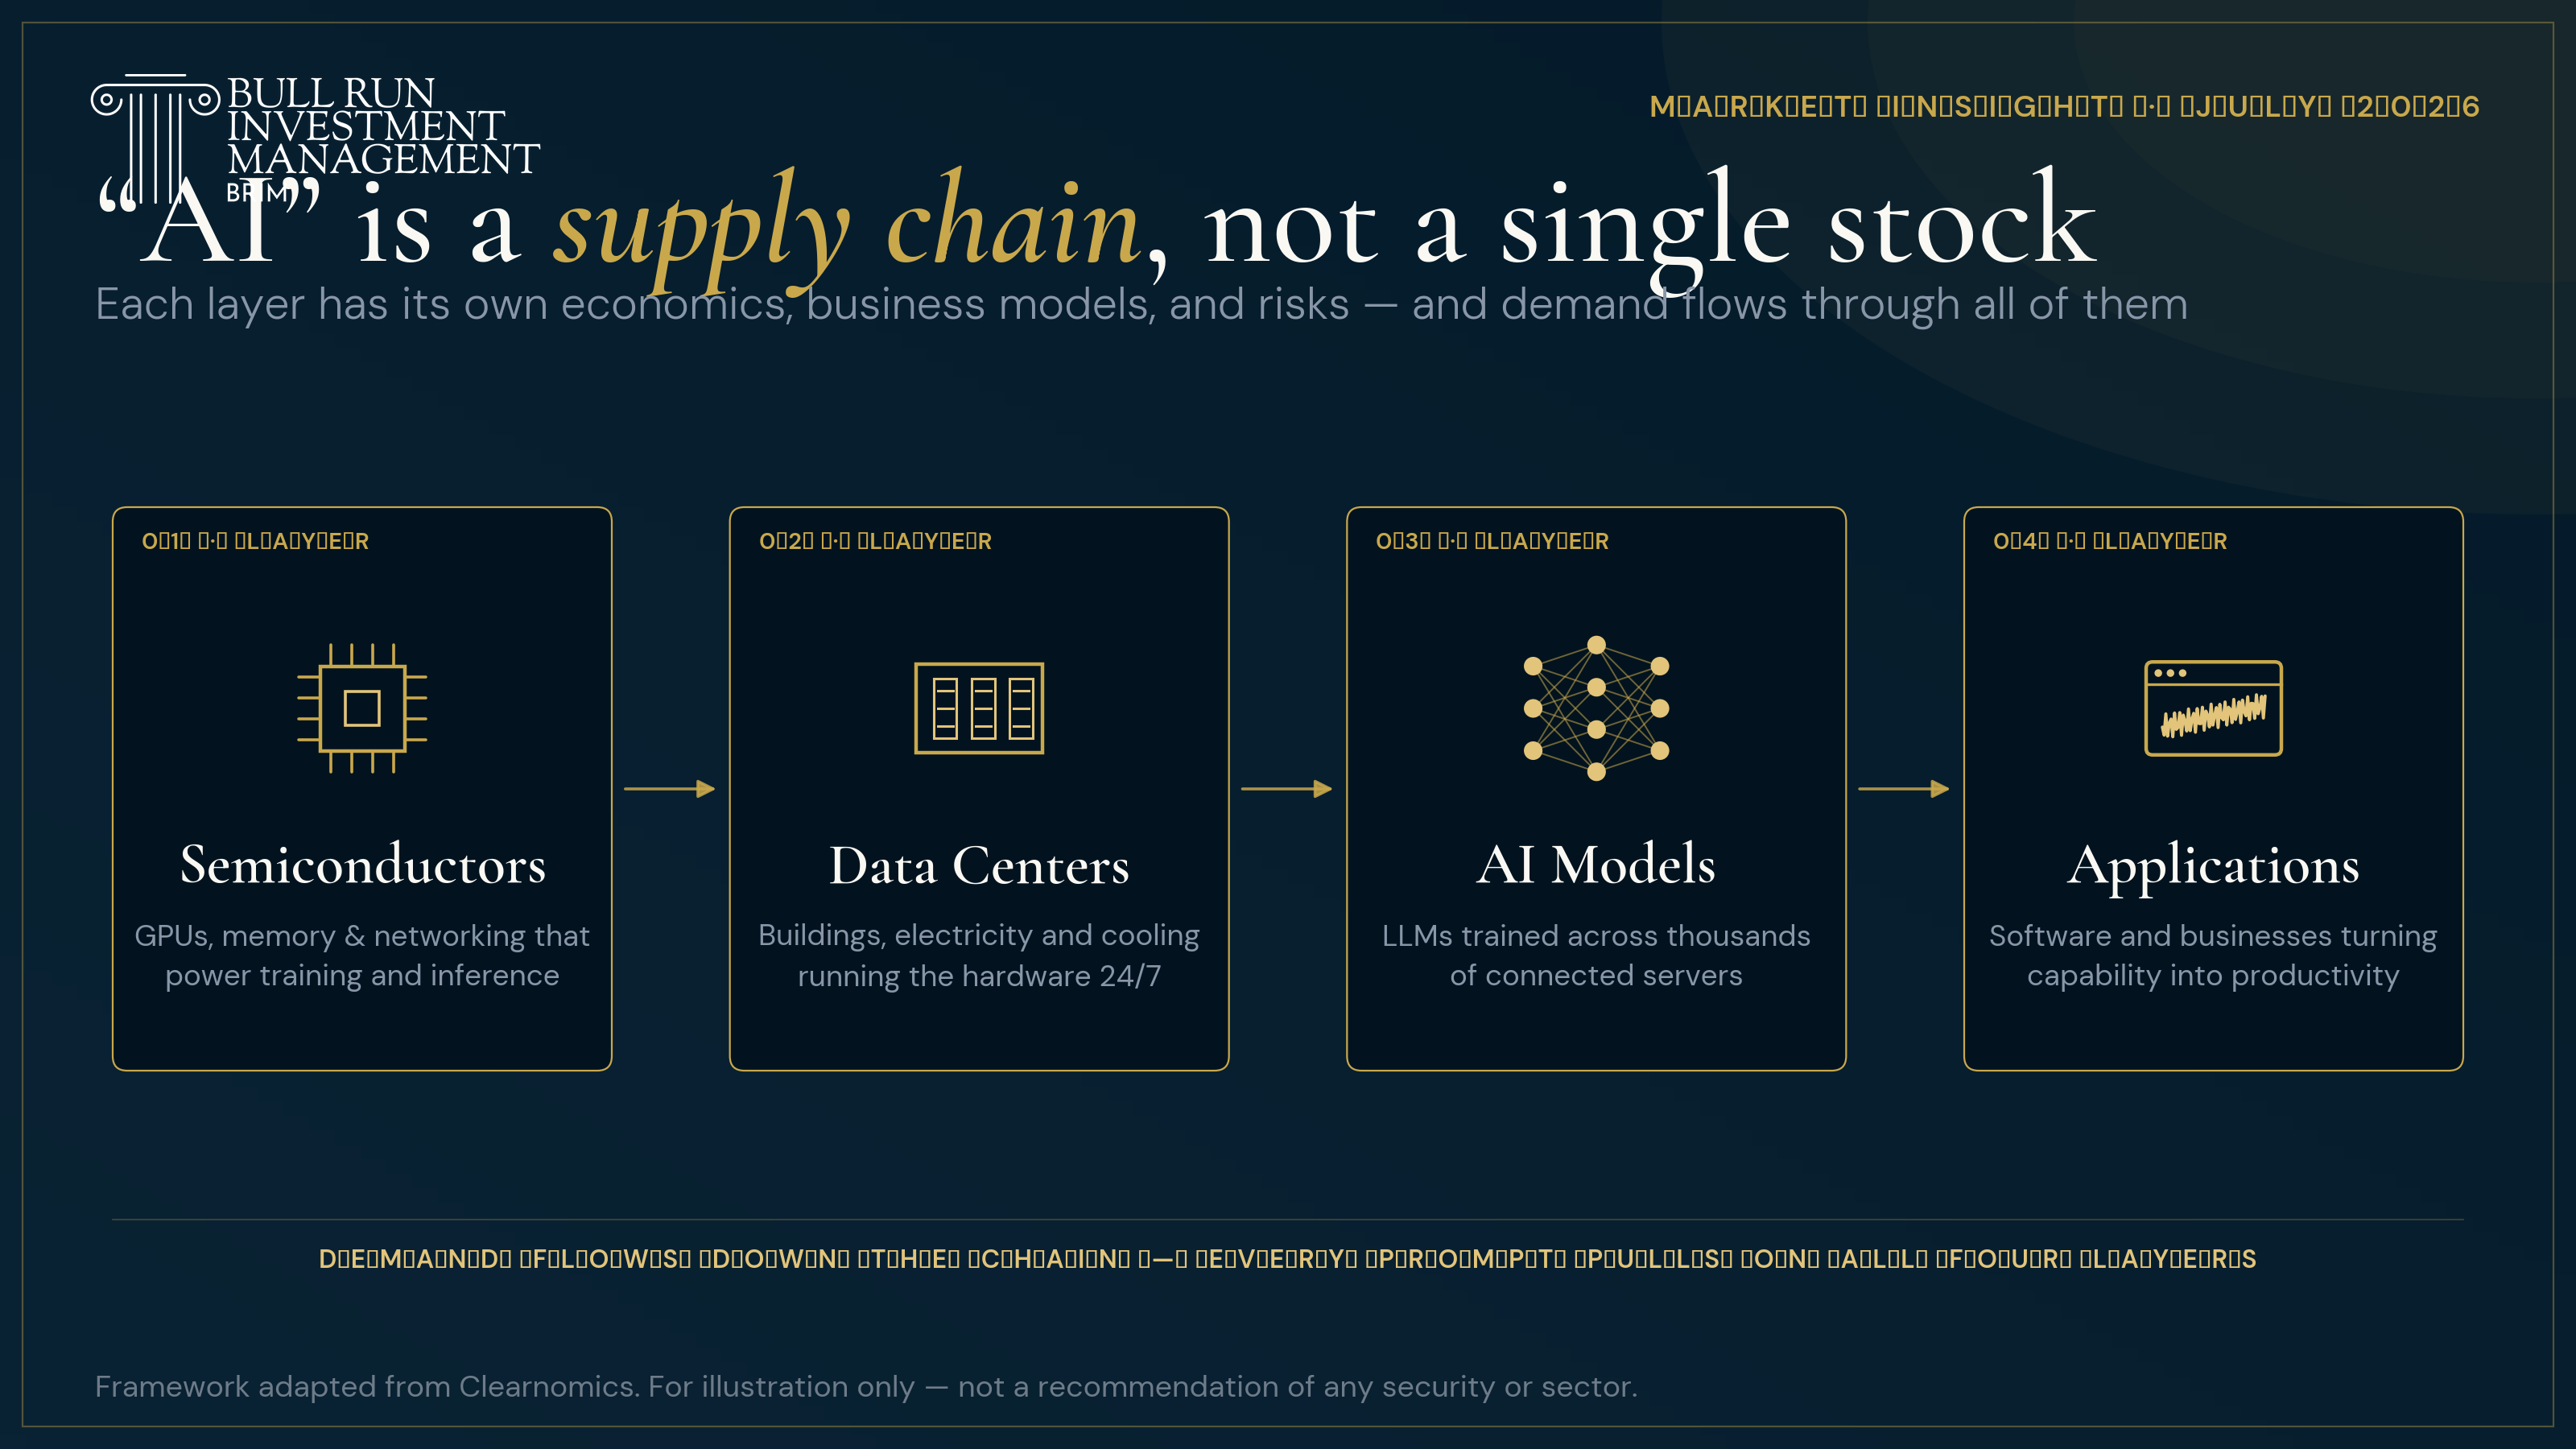
At the foundation is the semiconductor hardware, and it gets pulled on in two very different ways. The first is training — building the large language models themselves, a process that runs enormous datasets across thousands of connected servers for weeks or months. The second is inference — the everyday use of those models, where every single prompt consumes computing and memory resources to produce an answer. Together, they explain why demand and pricing for this hardware have surged, and why the companies supplying it carry the valuations they do.
Why does the distinction matter? Because a debate about any one layer — how much training compute the next model generation needs, say — is not a verdict on the whole chain. Inference demand, data center capacity, and software adoption each run on their own clock. Judging “AI” by one layer is like judging the auto industry by tire sales.
The buildout is real — and it’s in the government’s own data
Hardware has to live somewhere. Picture a data center as a warehouse packed floor-to-ceiling with servers running 24/7 — demanding security, electricity, and industrial-scale cooling. Scaling AI means building these at a pace with few precedents, and you don’t have to take Wall Street’s word for it: it shows up directly in the U.S. Census Bureau’s construction data.1
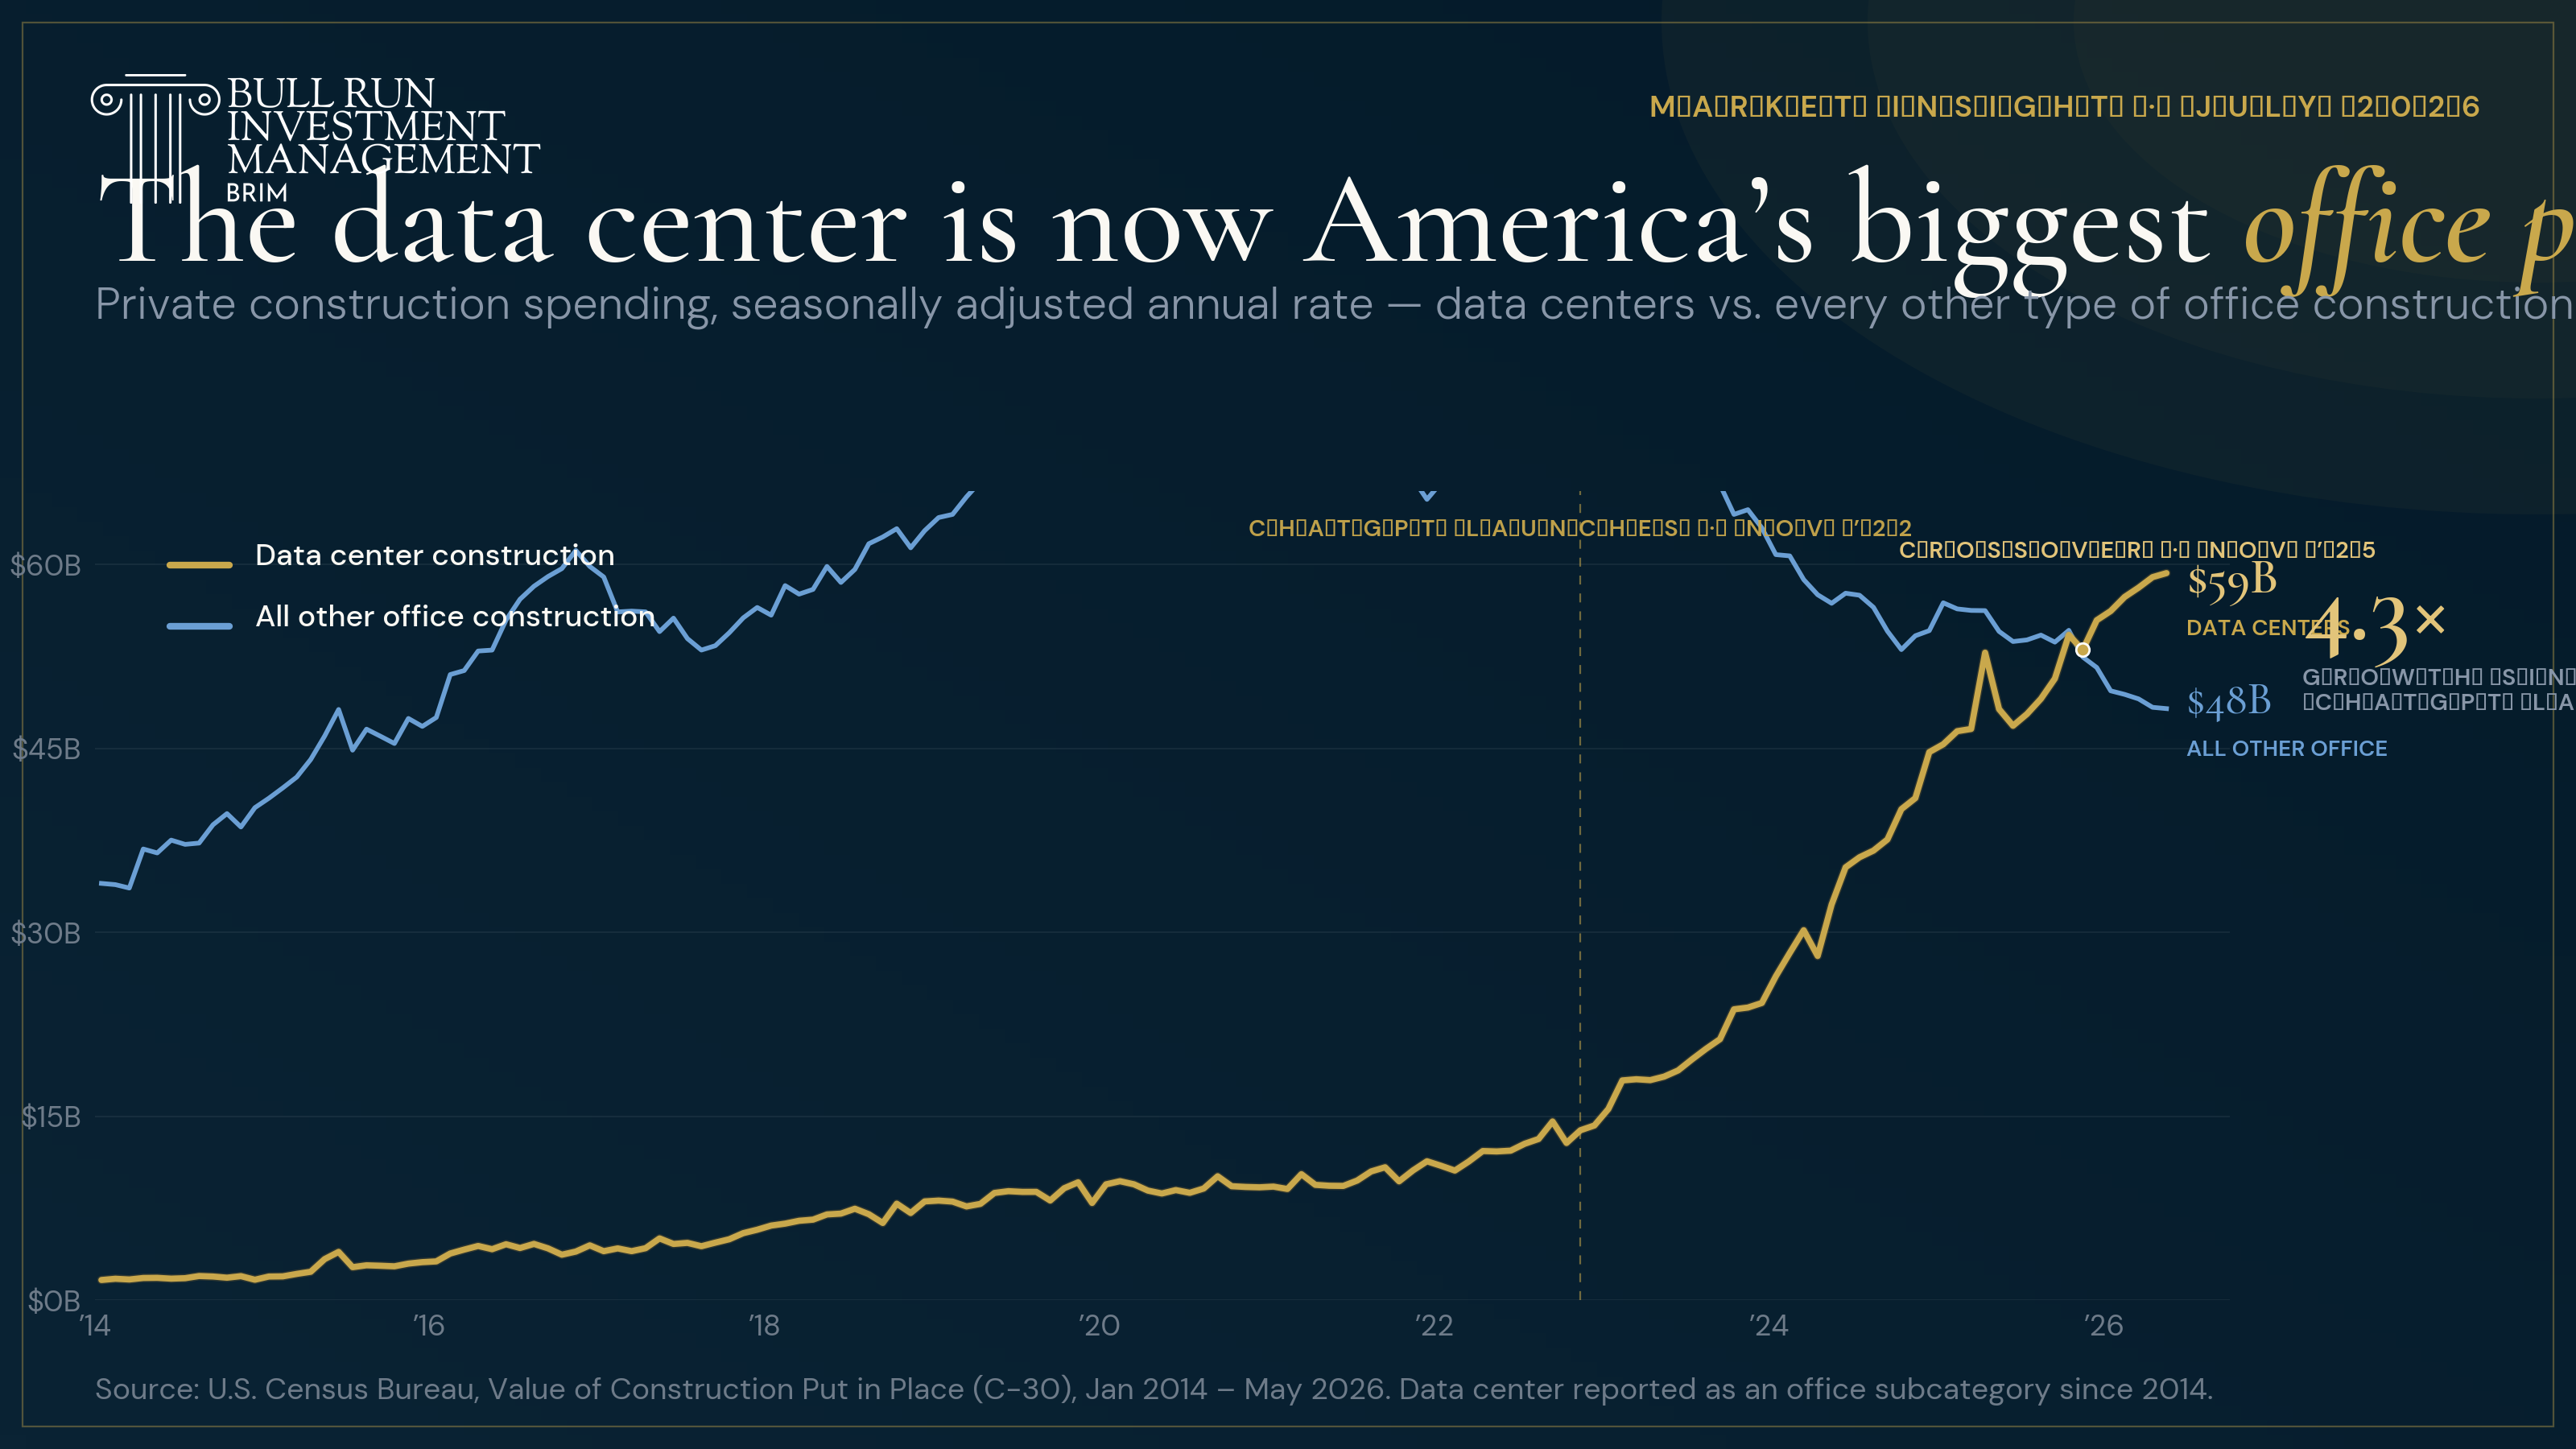
The inflection is unmistakable. When ChatGPT launched in November 2022, the U.S. was building data centers at a $13.9 billion annual pace. As of May 2026, that figure is $59.3 billion — more than a fourfold increase in three and a half years. And in November 2025, a quiet milestone: for the first time since the Census began breaking out data centers in 2014, America began spending more on data center construction than on every other category of office construction combined.
Construction · May 2026
Launched · Nov 2022
All Other Office Combined
Two honest caveats. Not all of this is strictly AI — broader cloud adoption and automation, especially since 2020, were already lifting demand for computing resources. And construction spending is an input, not a profit. But as a measure of how much real economic activity the AI theme is generating right now, it’s hard to find a cleaner one.
The central question: will hundreds of billions pay off?
Here is the debate at the heart of AI investing right now: will the enormous sums being poured into AI infrastructure — particularly by the largest technology companies — eventually generate sufficient returns? Demand for computing power has been substantial, supporting everyone who provides hardware and data center capacity. But as models improve, they also become more efficient, potentially needing less compute for a given task. That tension is a big reason AI-linked stocks have delivered their gains with stomach-churning swings.2
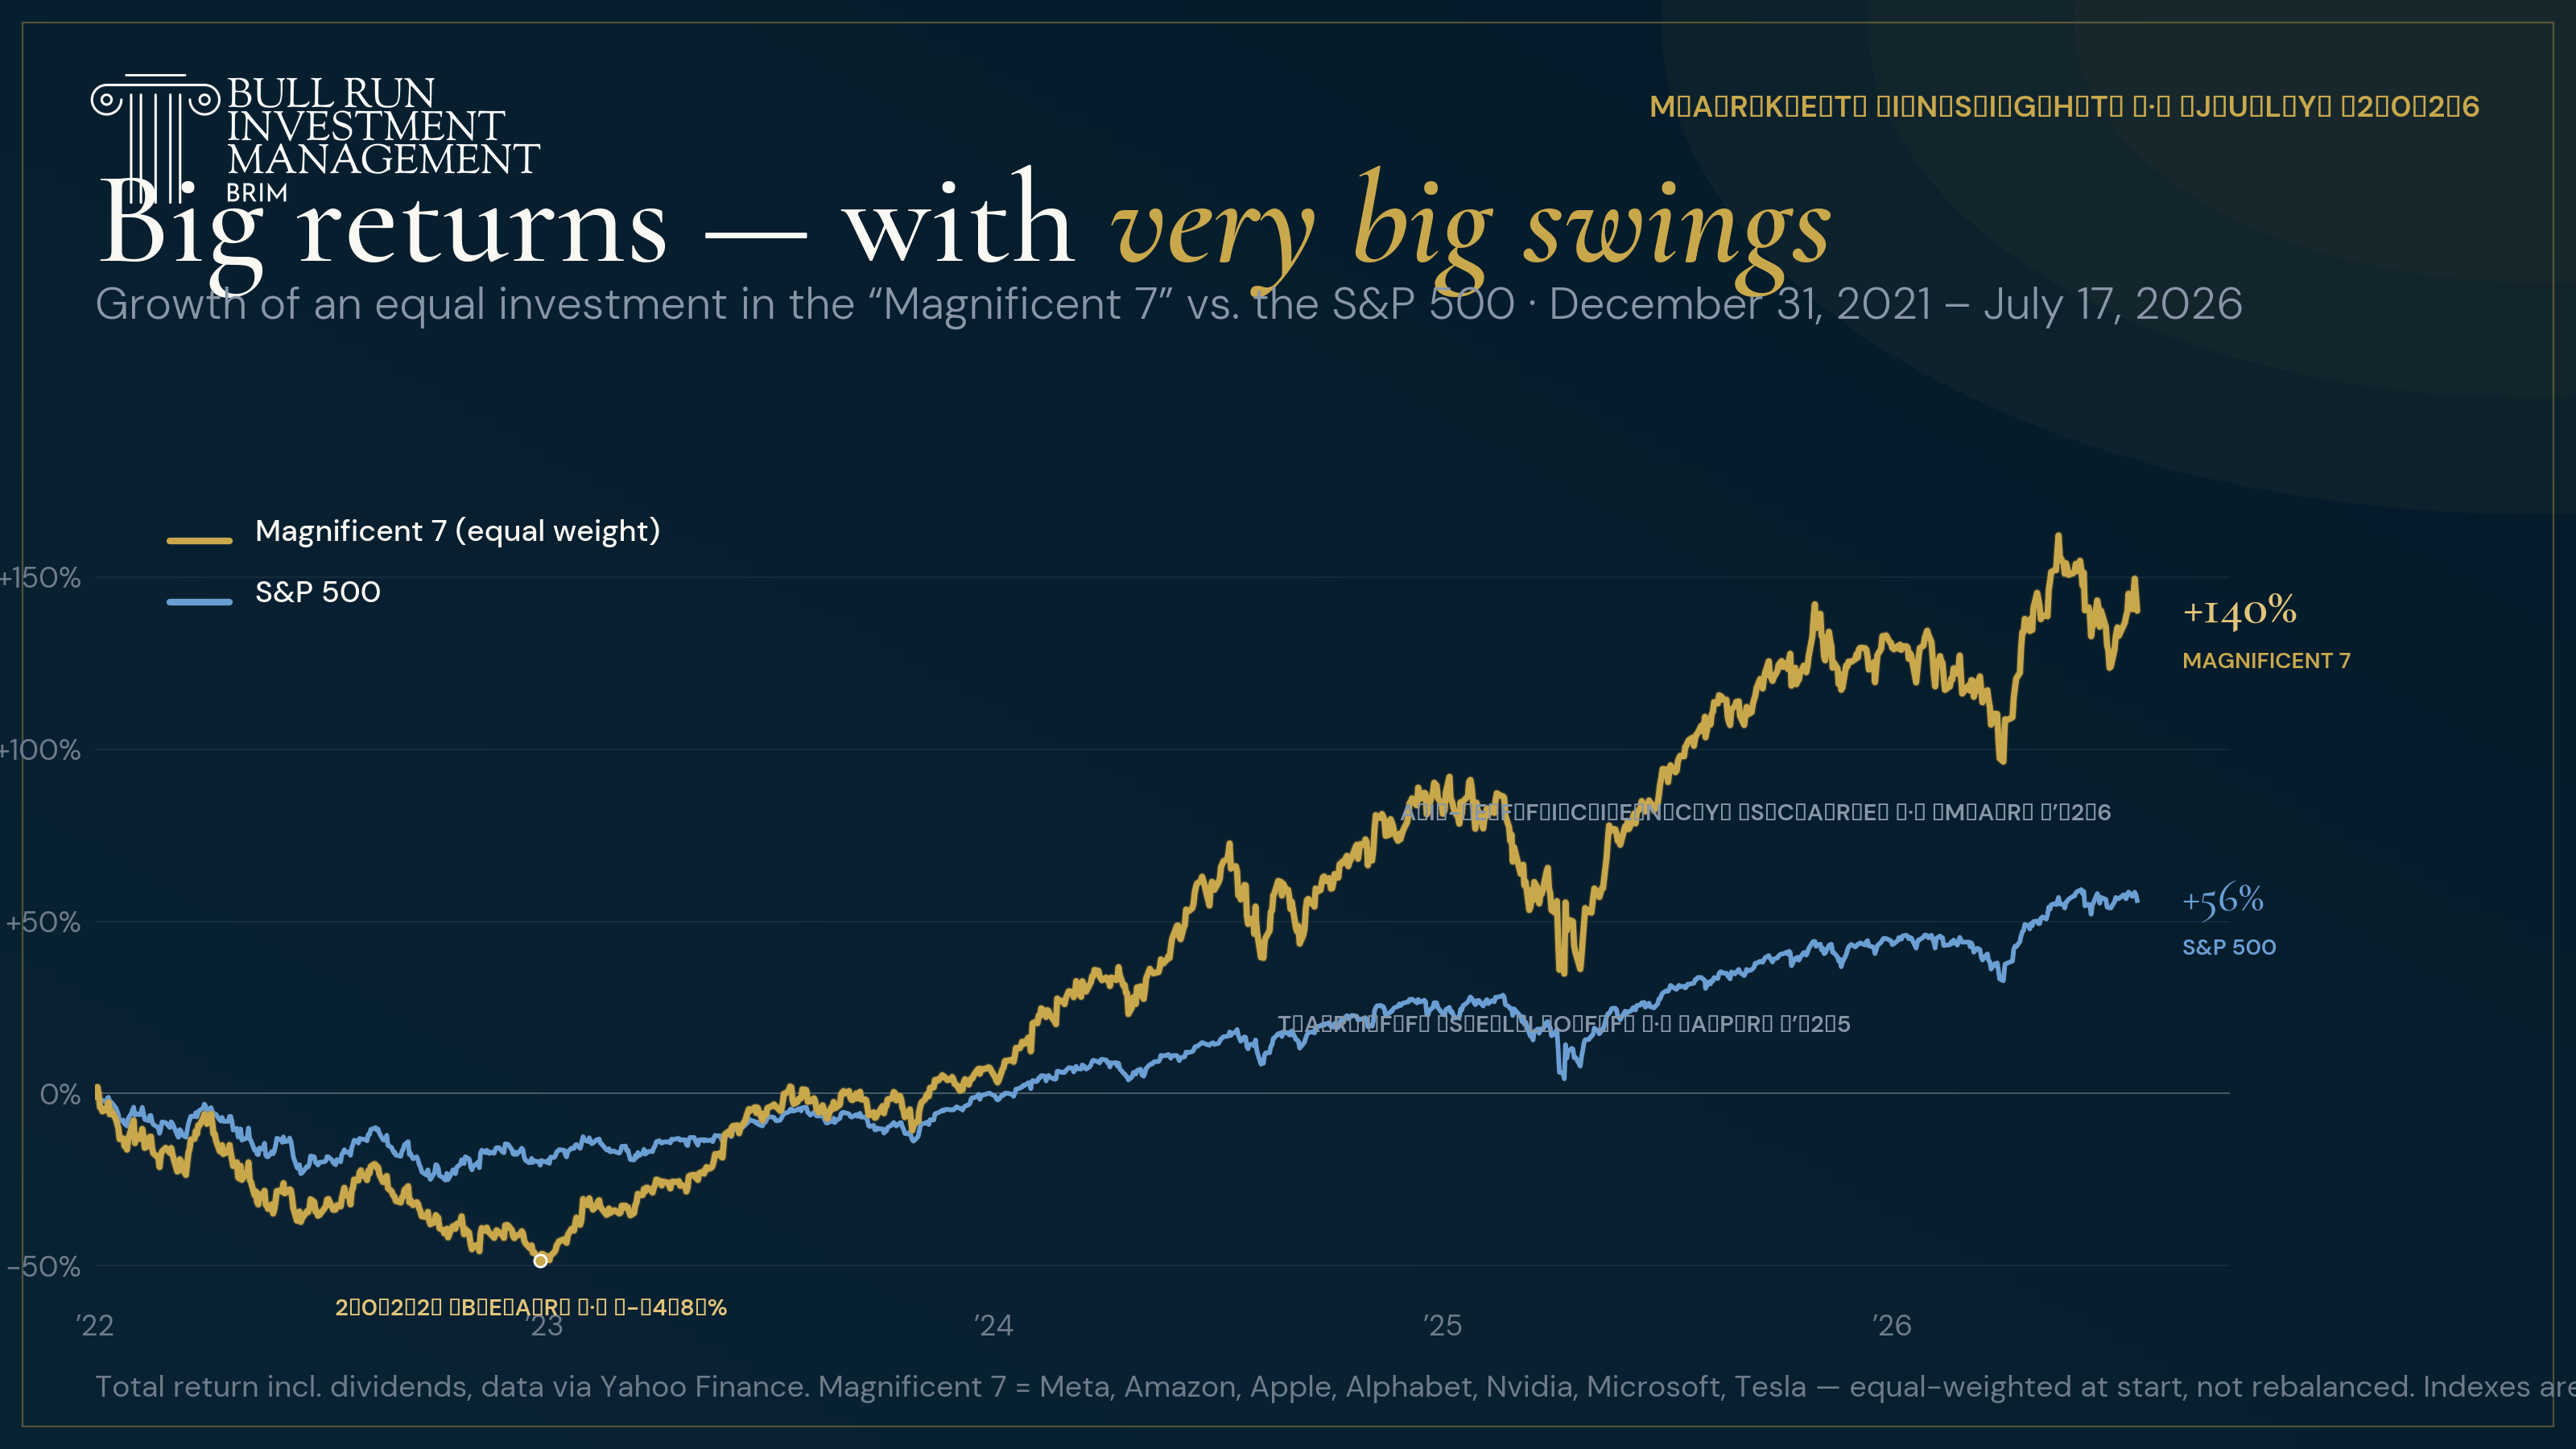
Since the end of 2021, an equal investment in the seven mega-cap technology leaders has returned roughly +140%, against +56% for the S&P 500 — but the path included a 48% drawdown in 2022, the tariff selloff of April 2025, and this year’s AI-efficiency scare, a roughly 19% peak-to-trough decline that bottomed on March 30, 2026. Each downswing had the same shape: optimism about the buildout, followed by doubt about whether demand would fill it.
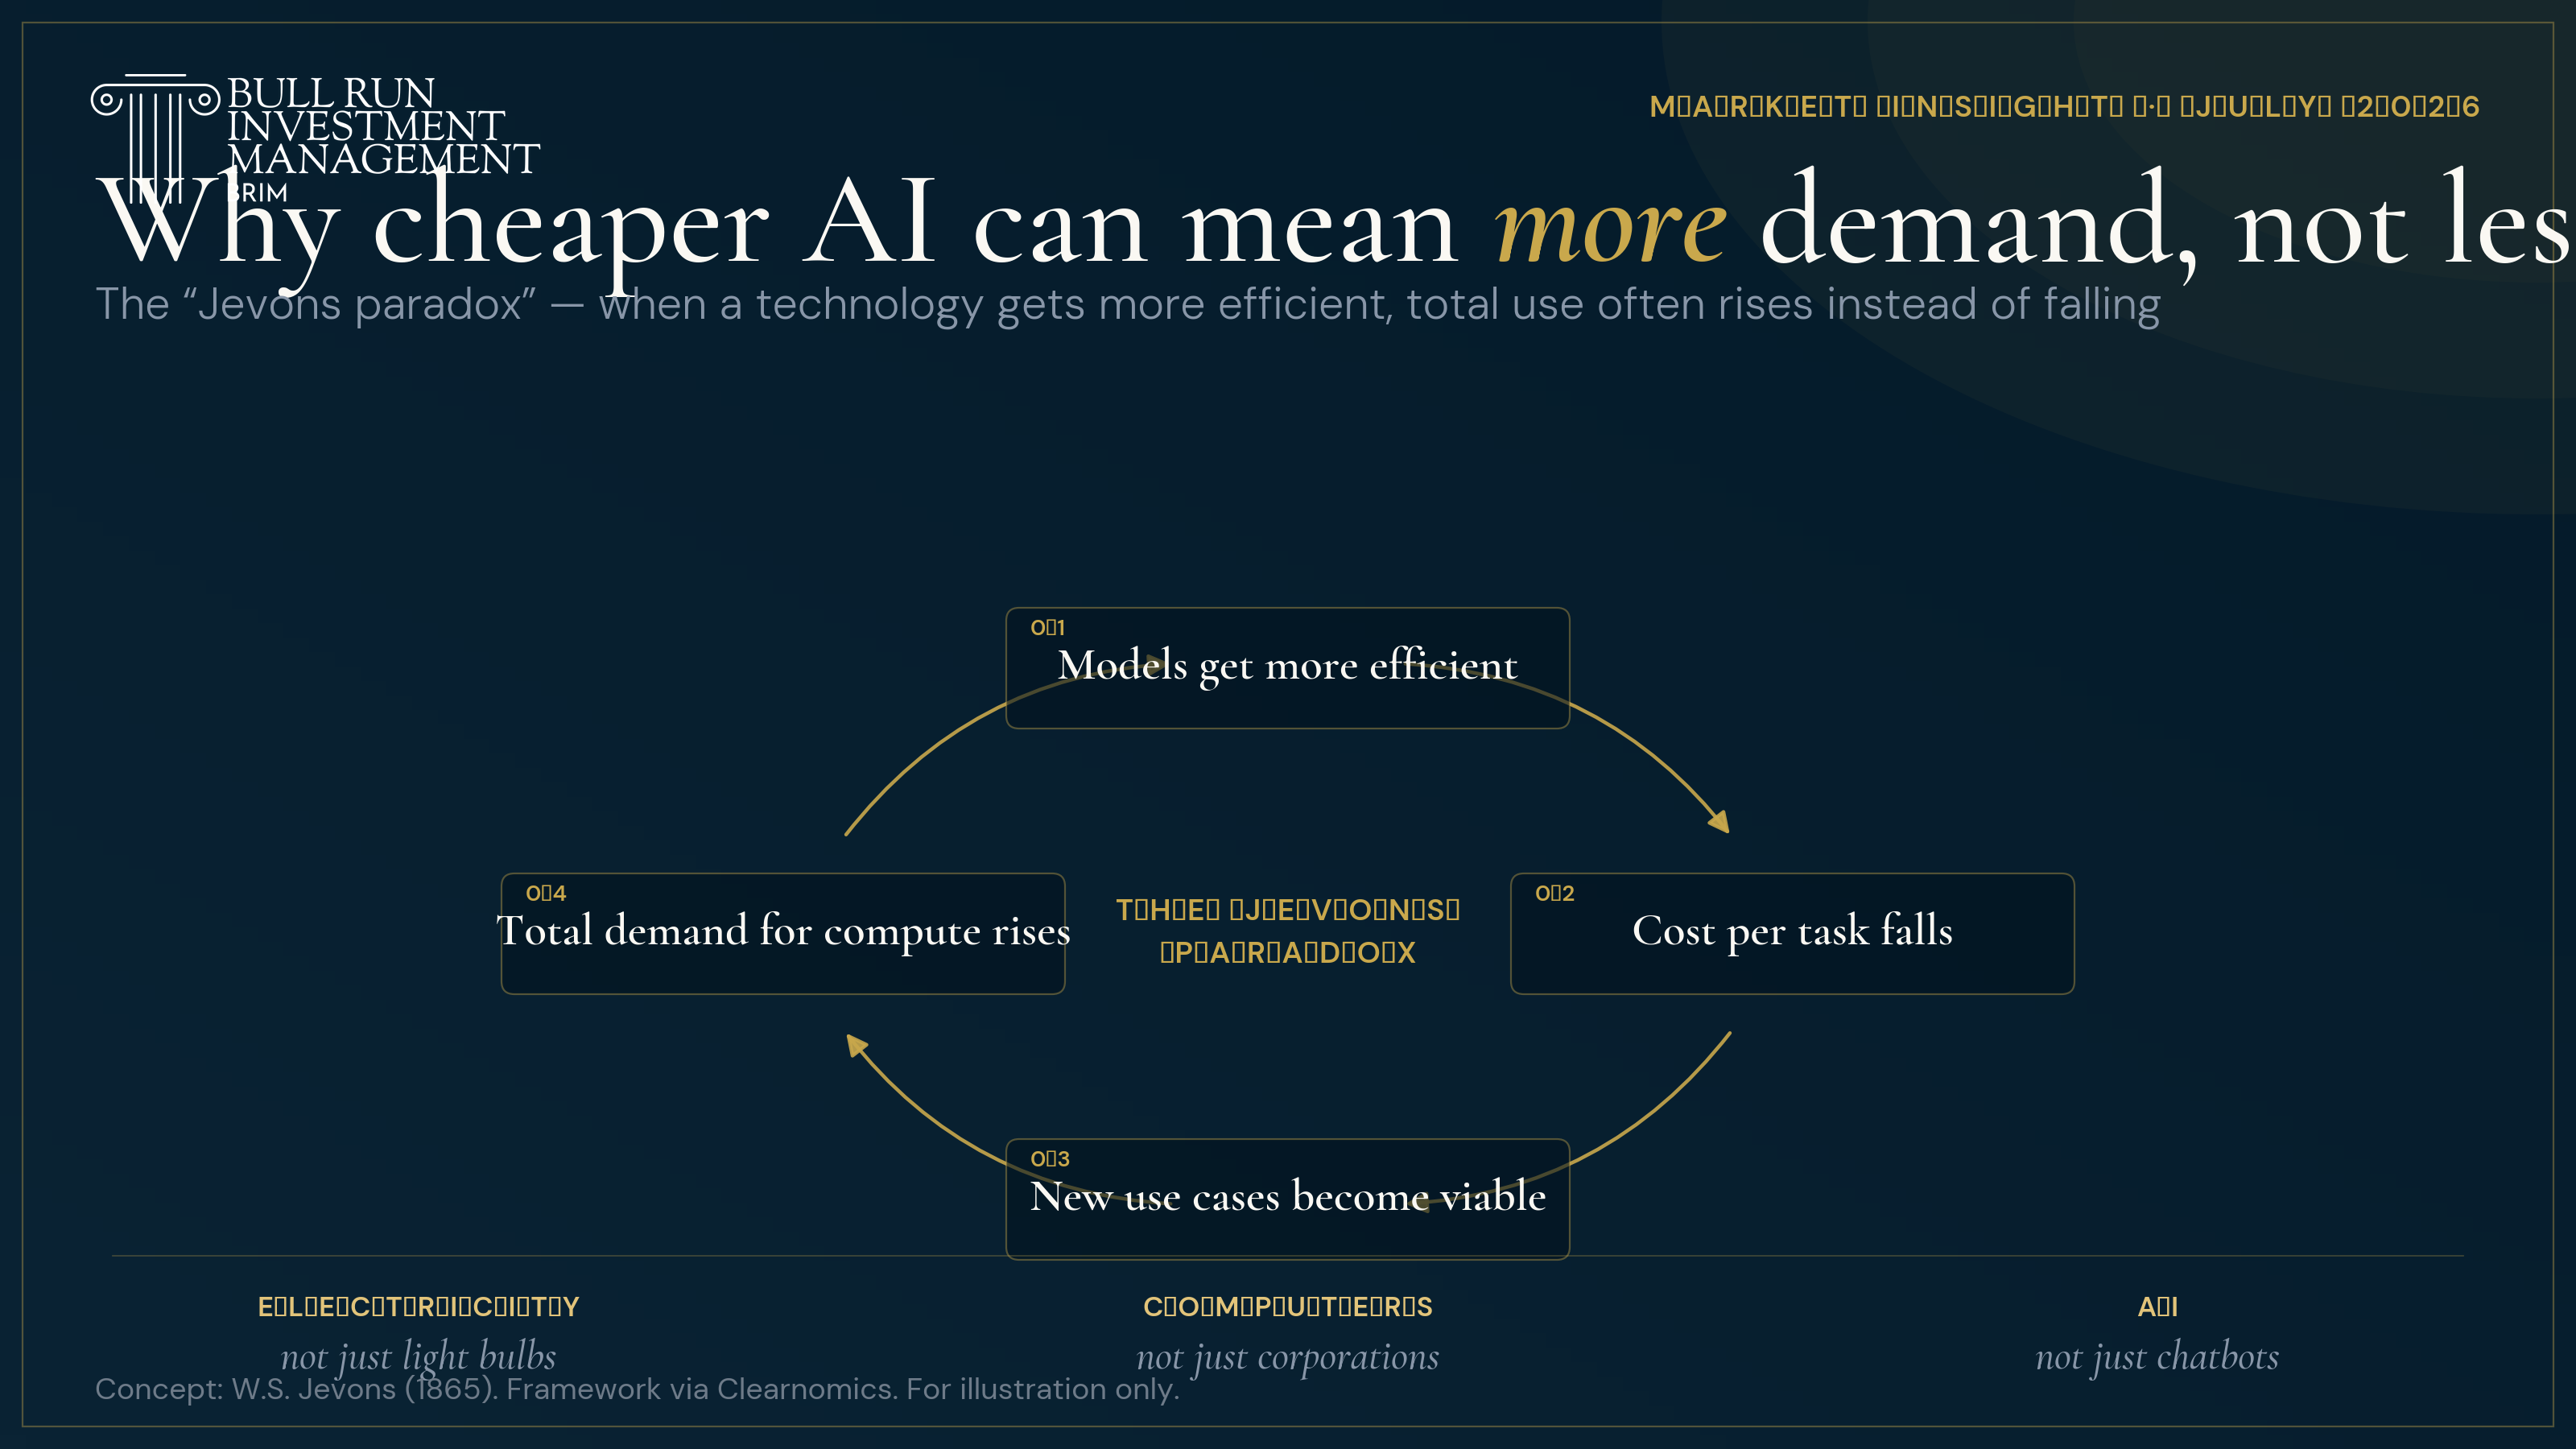
The efficiency worry deserves a direct answer, and history offers one. It’s called the Jevons paradox: when a technology becomes more efficient and its cost falls, total consumption often rises rather than falls, because cheaper capability unlocks uses that were never economical before. Electricity didn’t stop at light bulbs. Computers didn’t stop at corporations.
The counterweight is just as important: markets have a long record of overestimating how quickly new technologies turn into profits, even when the long-term potential is entirely real. The internet enthusiasm of the late 1990s took decades to fully play out — and vaporized plenty of capital along the way for investors who confused the theme with any particular stock. The lesson isn’t to avoid the theme. It’s to hold it with a broad view of the chain and a genuinely long horizon.
Valuations reflect high expectations
As AI has captured investor attention, valuations across the technology complex have moved steadily higher. The Information Technology sector currently trades at 21.4× earnings — elevated against both its own history and the broader market — and sectors like Communication Services and Consumer Discretionary, home to several of the same mega-cap names, show a similar pattern.3 These multiples aren’t irrational: they sit on top of genuinely strong earnings growth as AI demand builds. But they are demanding, and they leave less room for disappointment.
Here’s the discipline we’d emphasize: valuations are not a timing tool. They tell you very little about what markets will do tomorrow. What they are useful for is deciding the appropriate mix of assets in a portfolio — where expectations are stretched, where they aren’t, and how much of each risk you want to own on the way to your actual financial goals. Plenty of other market segments carry attractive valuations with solid expected earnings growth of their own, which is exactly why the AI theme belongs inside a portfolio, not instead of one.
How we own the theme: the Equity Innovation SMA
Everything above is the market’s evidence. Here is our answer to it. The BRIM Equity Innovation SMA is our concentrated portfolio of what we believe are the fastest-growing companies across the AI, software, and cloud-infrastructure landscape — the supply chain in this note, expressed as an actively managed strategy. This is not a theme we discovered this quarter; it’s the strategy’s entire design, and it has a track record:
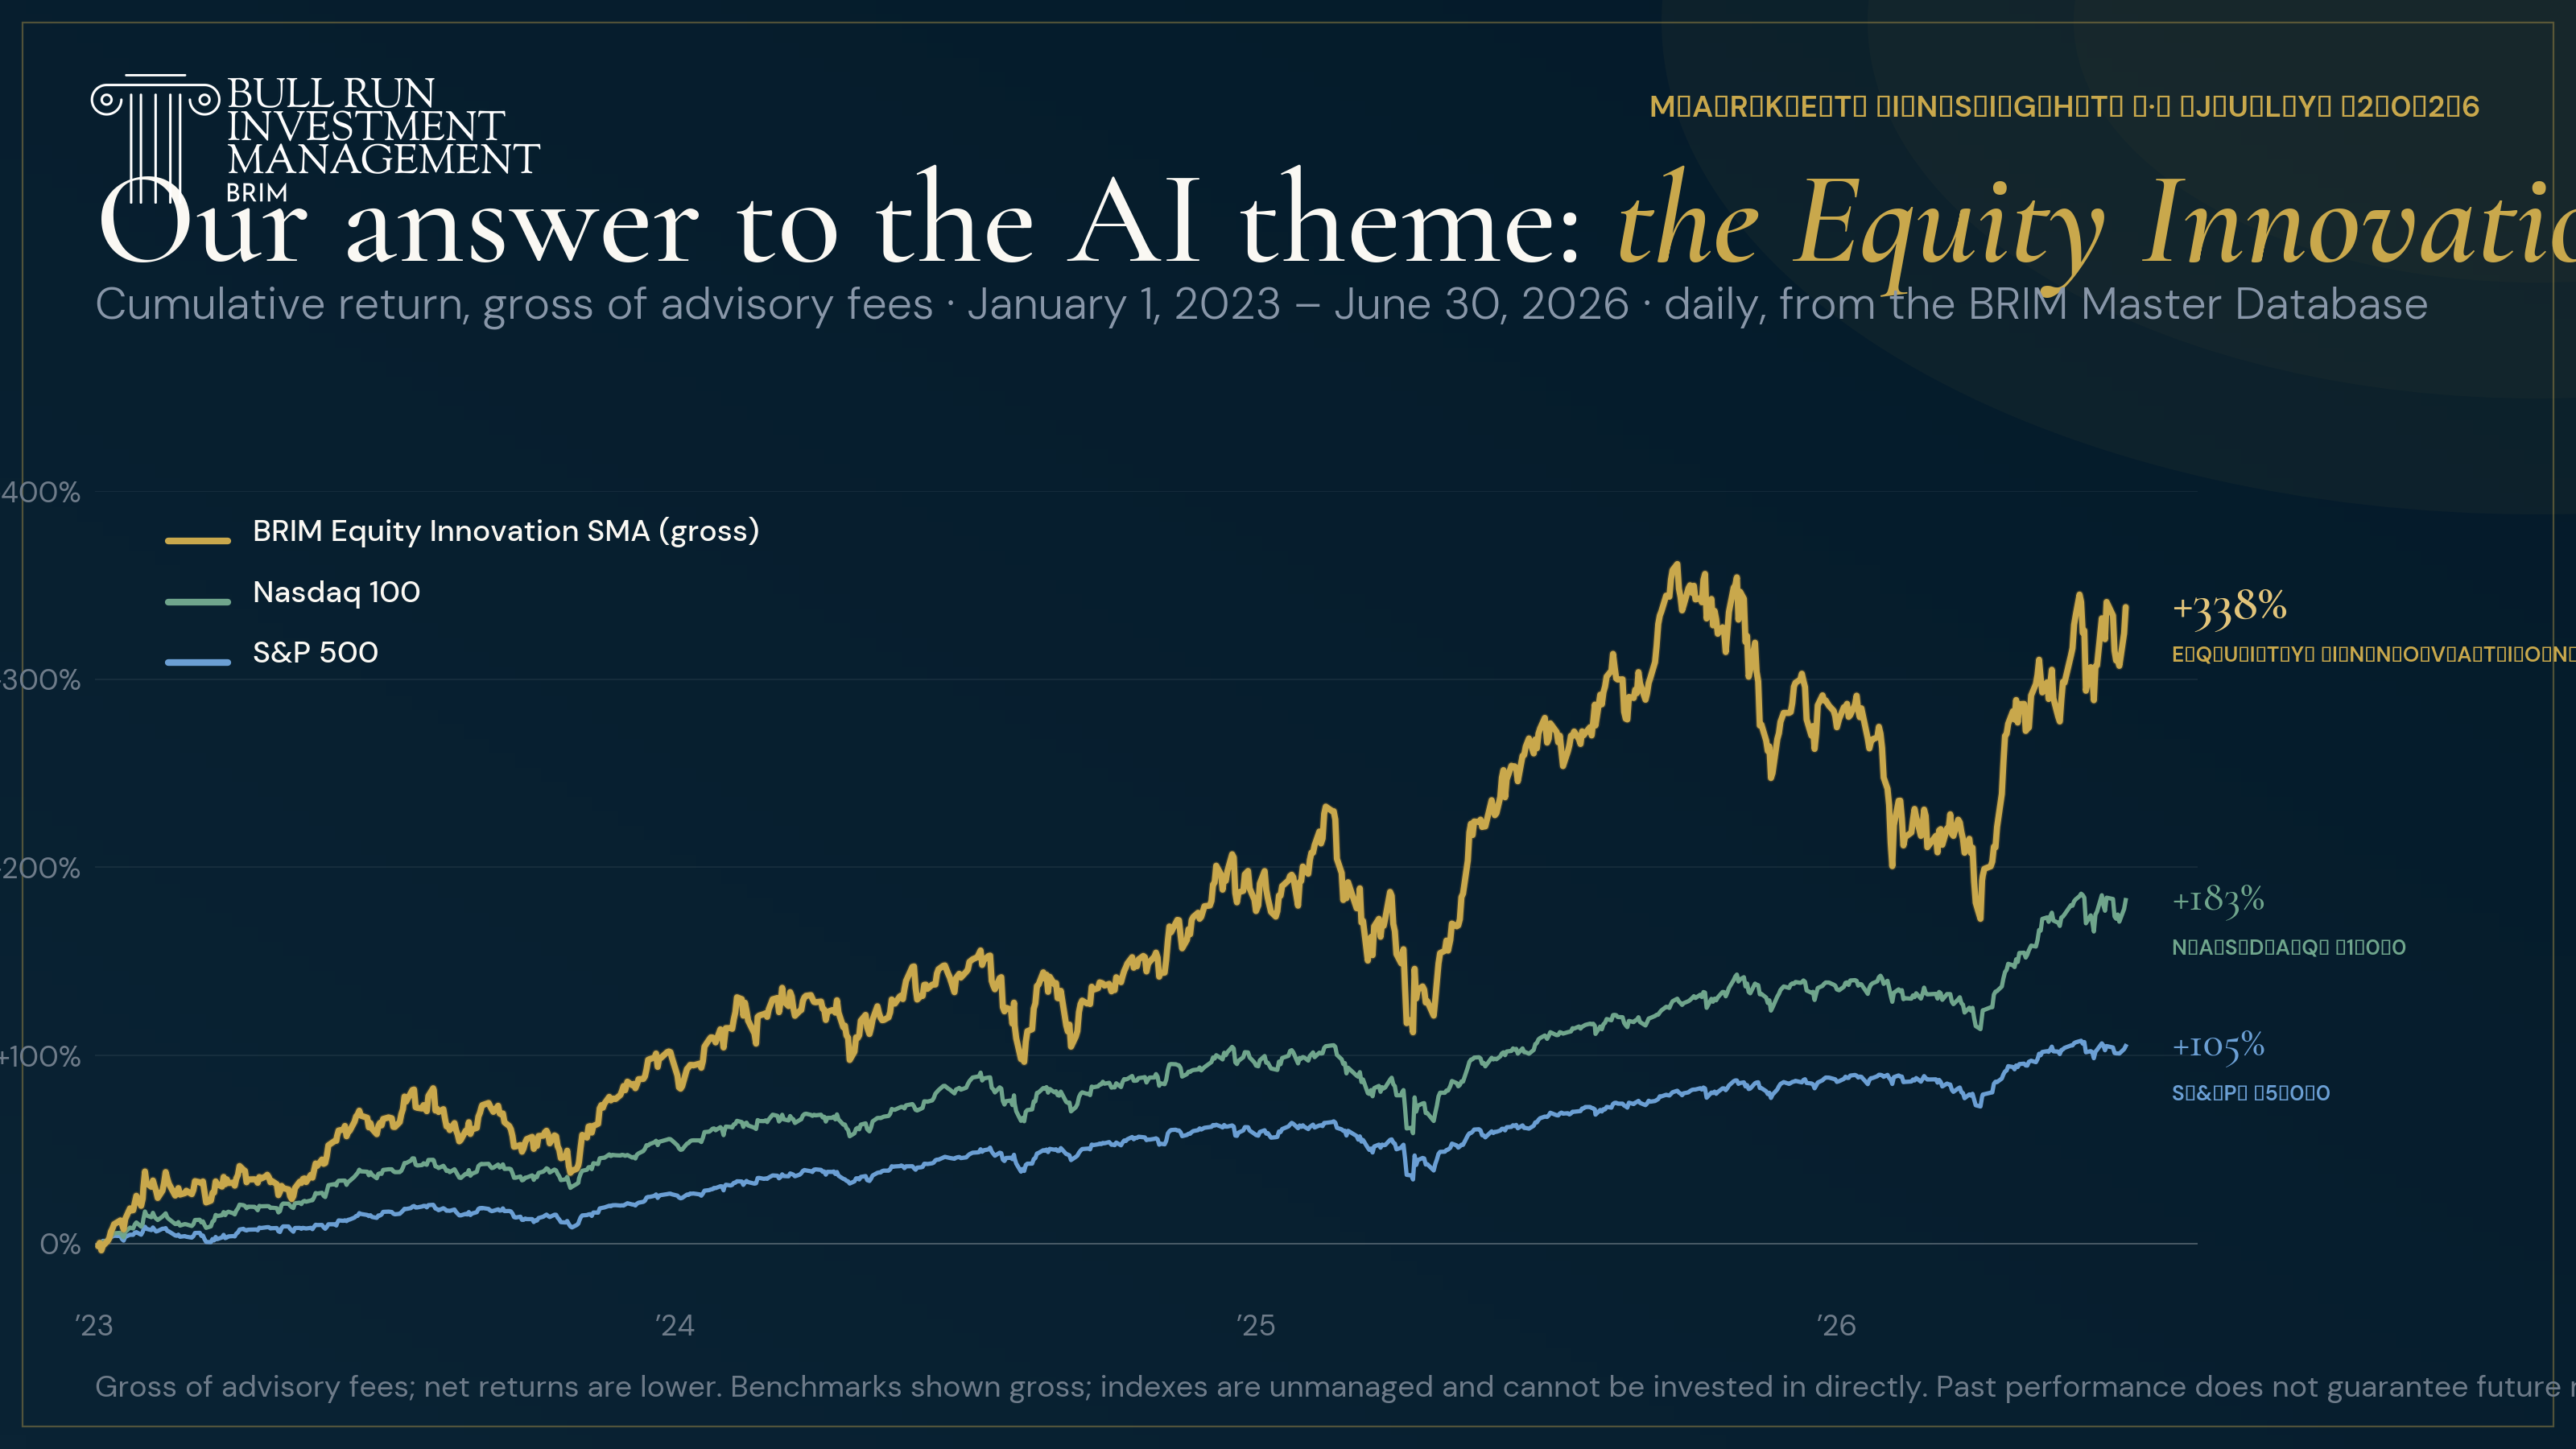
And with Q2 in the books, here is the same record scored against the complete universe of non-leveraged ETFs — every fund in America with a full track record over each period, using YCharts total-return data. Through June 30, 2026:
| Year | Innovation SMA | S&P 500 | Percentile Rank | Funds in Universe |
|---|---|---|---|---|
| 2023 | +98.4% | +26.3% | Top 1.18% | 3,479 |
| 2024 | +39.3% | +25.0% | Top 3.10% | 4,061 |
| 2025 | +35.2% | +17.9% | Top 8.12% | 4,854 |
| 2026 YTD | +17.1% | +10.3% | Top 17.34% | 5,969 |
| Since Jan 2023 | +337.4% | +105.2% | Top 0.75% | 3,479 |
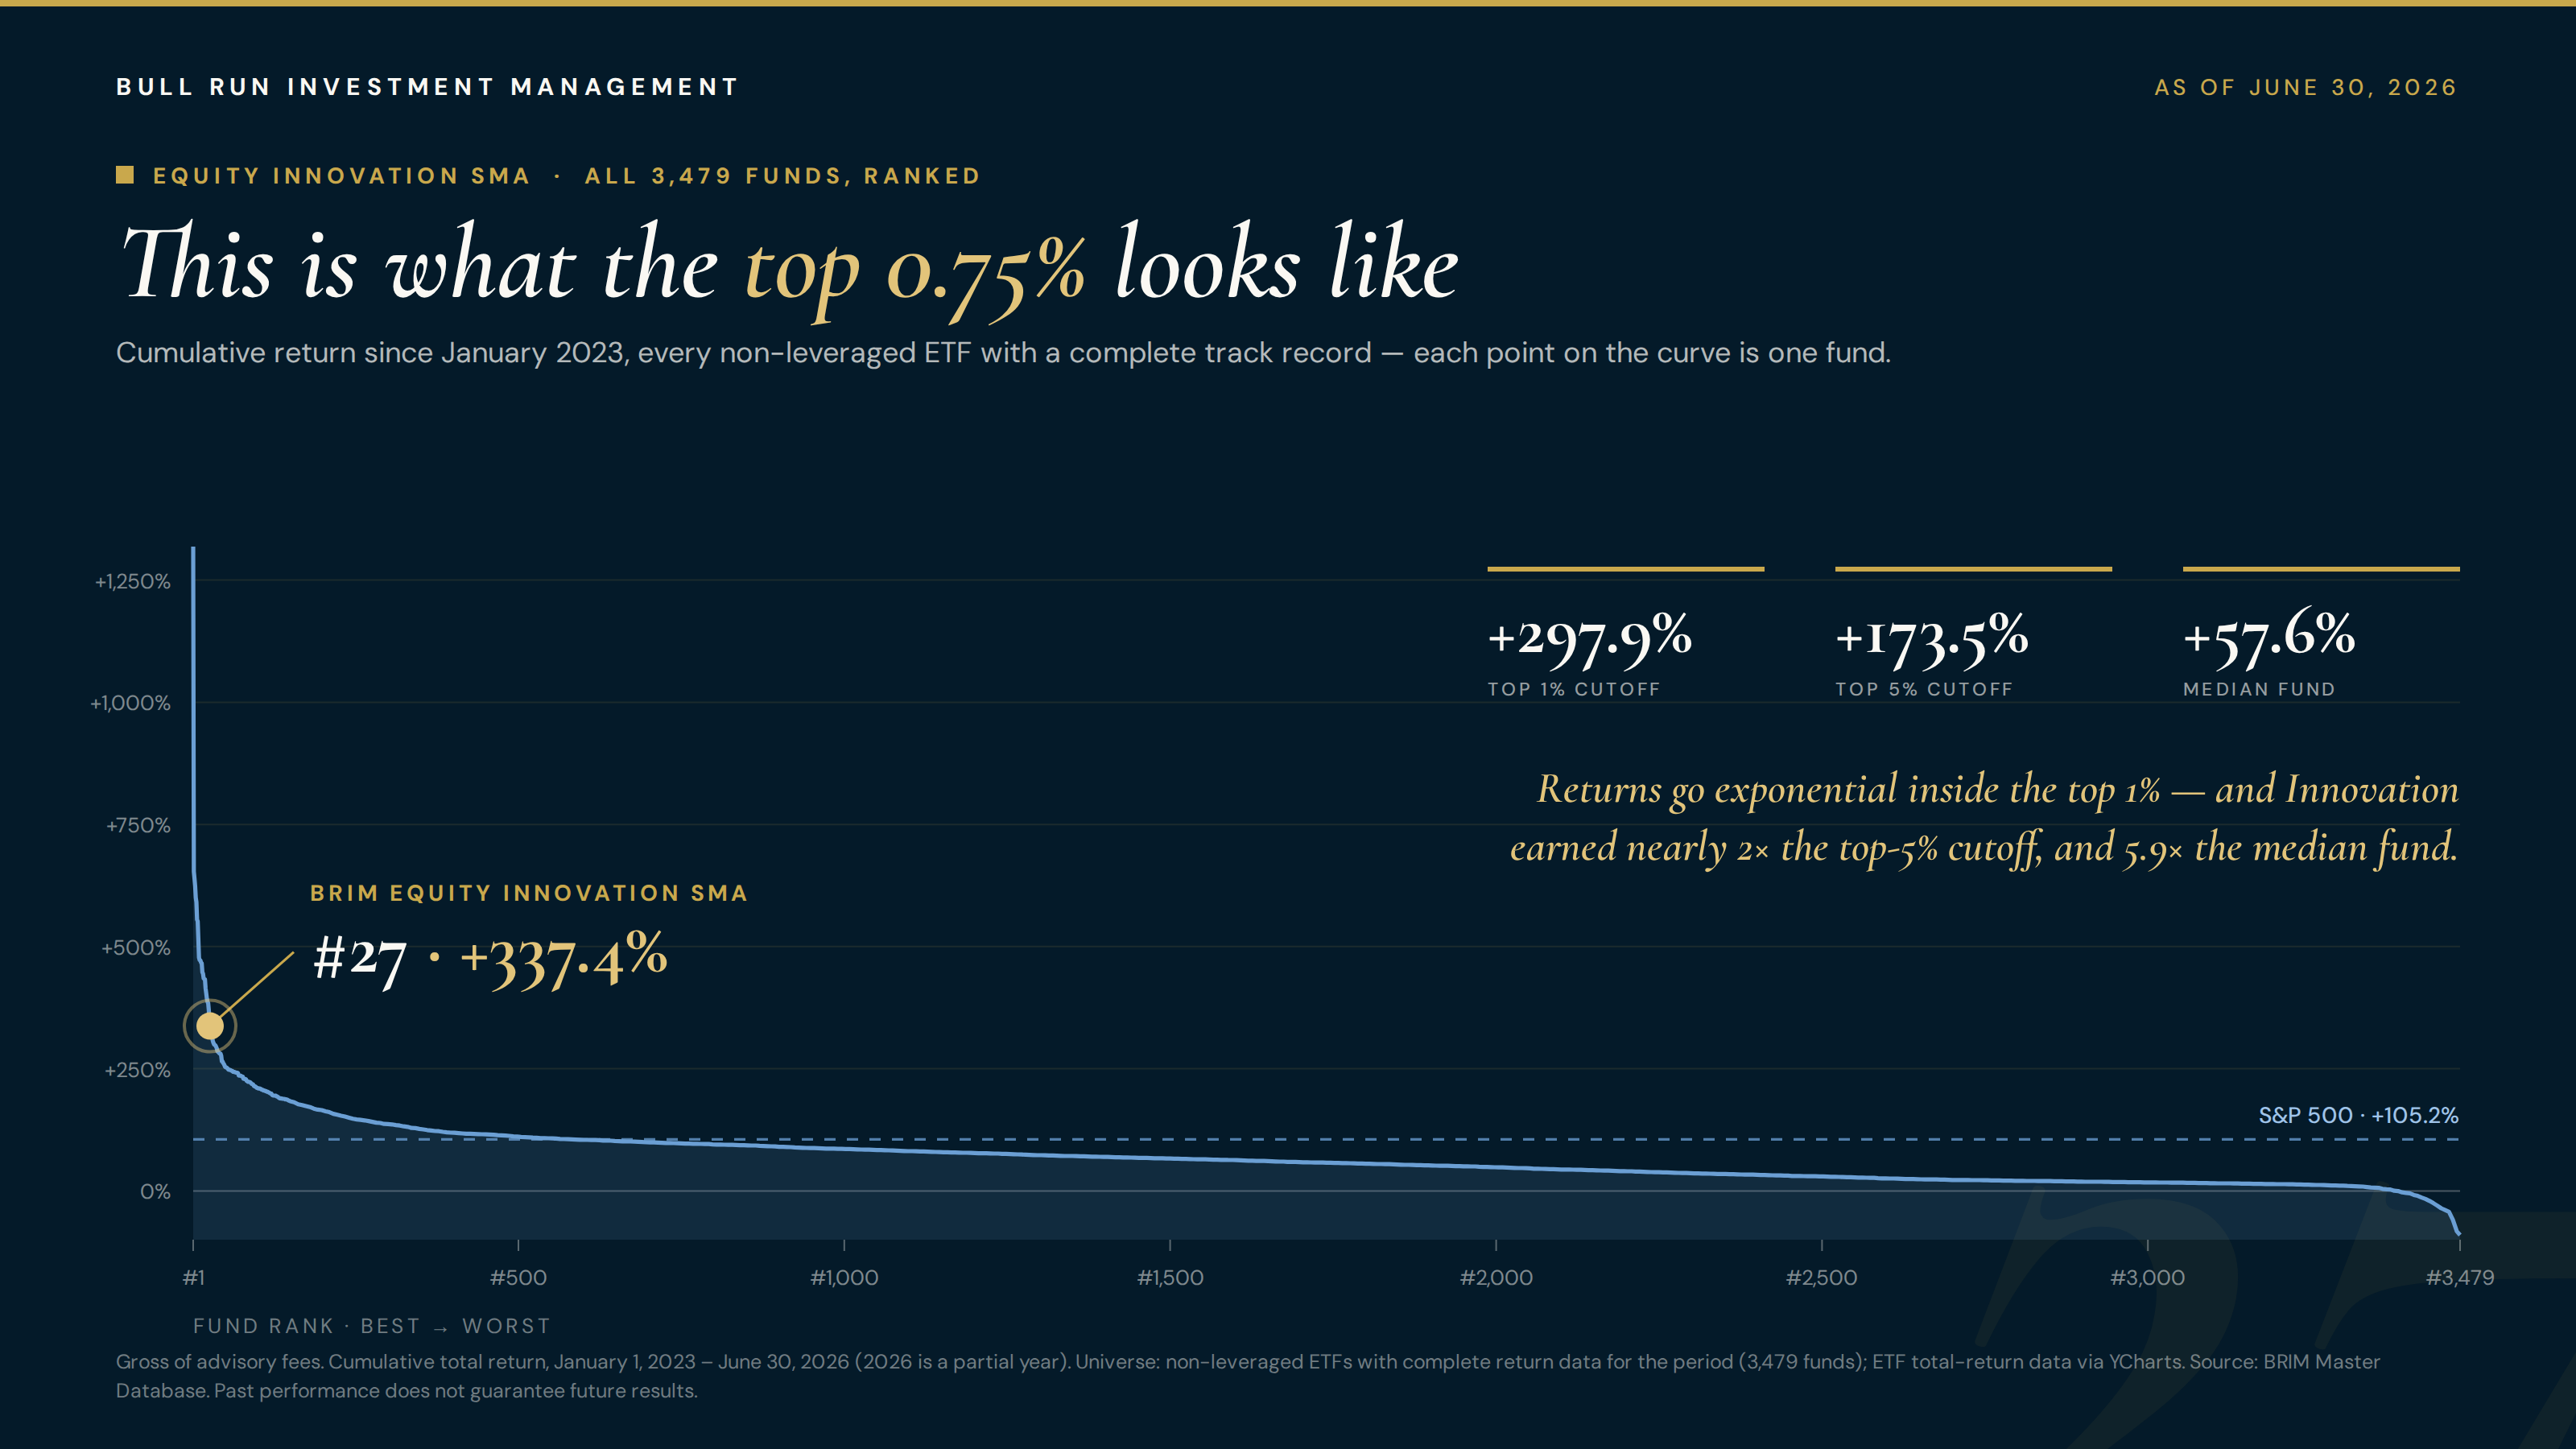
That cumulative +337.4% since January 2023 ranks #27 out of 3,479 non-leveraged ETFs — the top 0.75% of the universe. (All figures gross of advisory fees; 2026 is a partial year through June 30.)
Don’t take our word for it — verify it yourself, live →The full comparison table is public: every fund, every calendar year, every rank, powered by the same database that runs our client reporting. We believe in showing our work.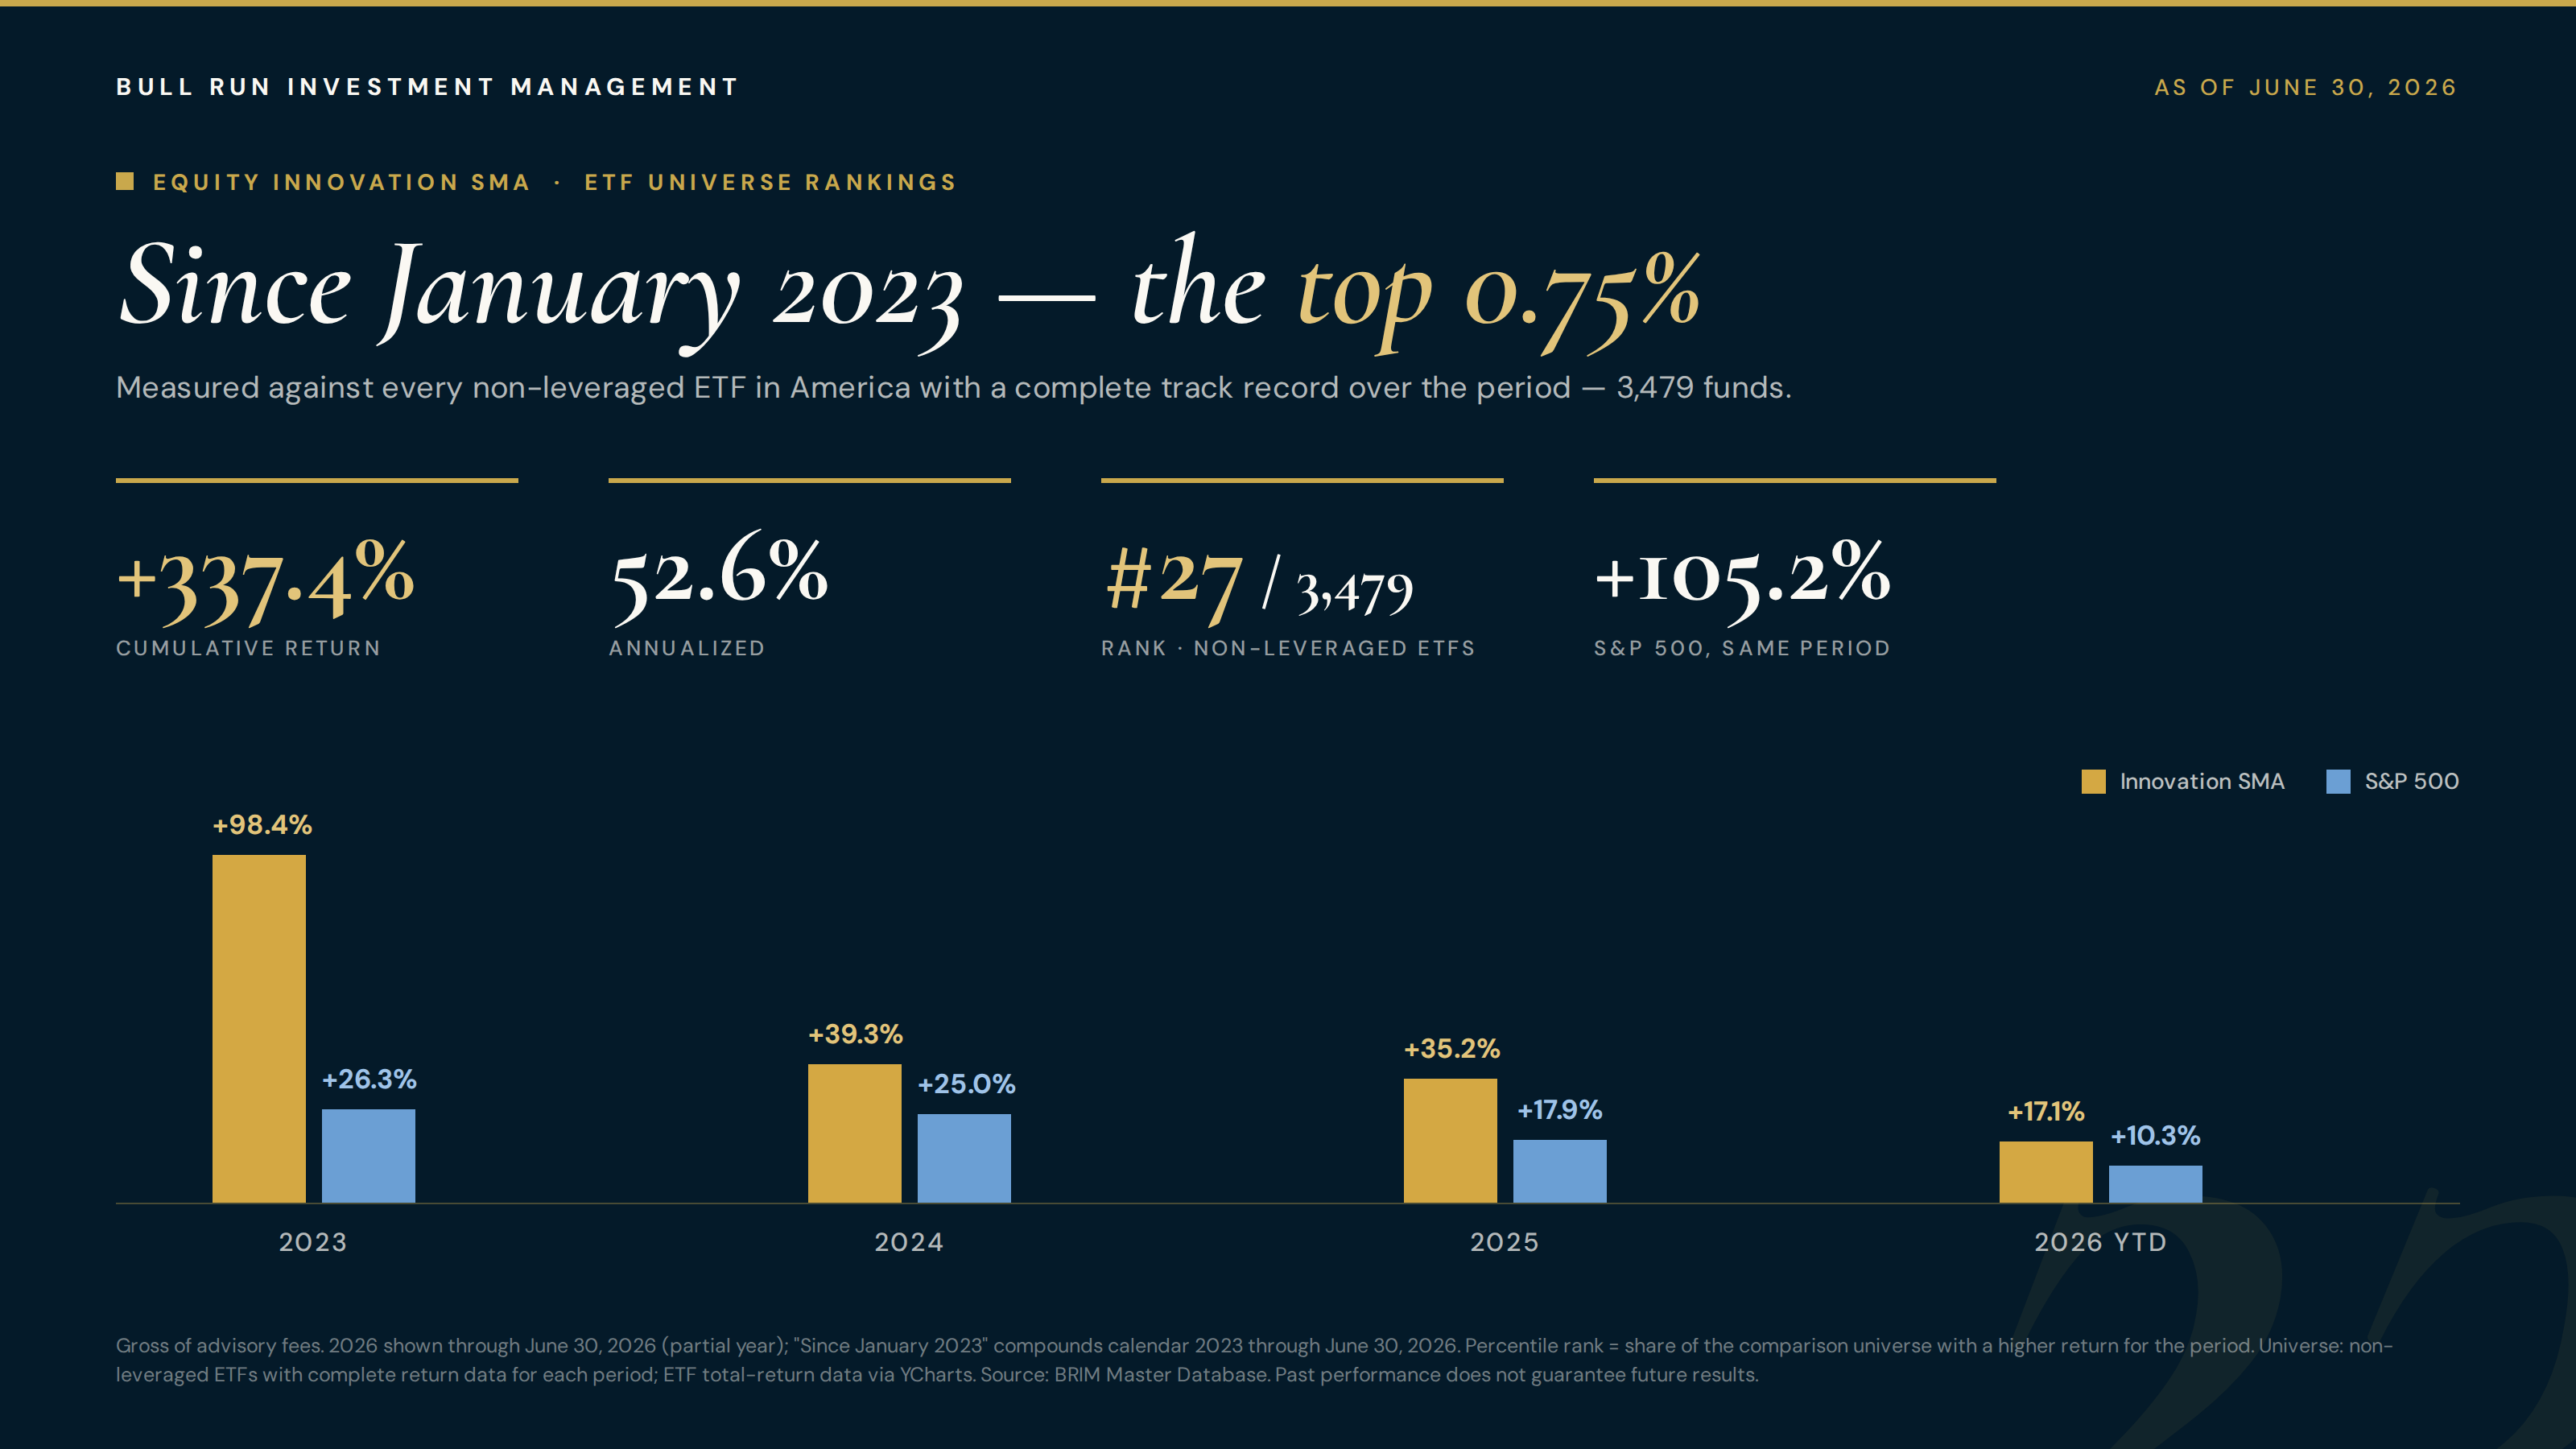
One thing we want to be clear about: a concentrated growth strategy is the highest-octane way to own this theme, and it comes with the drawdowns to match — our own 2026 round trip, chronicled in our July note, is Exhibit A. That’s why it lives alongside our Growth, Core, and Low Volatility strategies inside client portfolios sized to each household’s goals and risk tolerance — the AI theme inside a portfolio, not instead of one.
All four BRIM equity SMAs — Innovation, Growth, Core, and Low Volatility — are available to outside advisors through the Charles Schwab Managed Account Marketplace. If your clients are asking how to own the AI theme without buying a grab-bag ETF, the live rankings table above is exactly what your due-diligence process wants to see. Reach out and I’ll walk you through it.
Talk directly with the portfolio manager — not a sales team. We’ll walk through your goals and how our four proprietary SMA strategies fit.
Book a MeetingThe bottom line
The trends driving AI go far beyond a handful of technology companies. There is a full supply chain underneath every chatbot — semiconductors, a $59-billion-a-year construction boom, the models, and the software putting them to work — and each layer carries its own opportunities and its own risks. AI is transformational and genuinely hard to forecast; both things are true, which is exactly why the right posture is a broad view of the chain, honest attention to valuations, and a long time horizon anchored to your actual financial goals.
That’s how we run it: the theme expressed through a disciplined, concentrated strategy — sized inside a portfolio built for the whole plan, not the whole portfolio bet on the theme.
Own the supply chain.
References — 1. U.S. Census Bureau, Value of Construction Put in Place (C-30), data through May 2026. 2. The Magnificent 7 companies include Meta, Amazon, Apple, Alphabet, Nvidia, Microsoft, and Tesla; return data via Yahoo Finance as of July 17, 2026. 3. Clearnomics research and LSEG data as of July 17, 2026.
Your introduction to Bull Run starts here.
Schedule a complimentary, no-obligation call so we can understand your financial goals and show you exactly how our proprietary SMA strategies are managed — or send a note below and Chris will reach out directly.