
5 Insights for Long-Term Investors in the Second Half of 2024
Five points for long-term investors heading into the second half of 2024, from the rally so far to the election.
5 Insights for Long-Term Investors in the Second Half of 2024
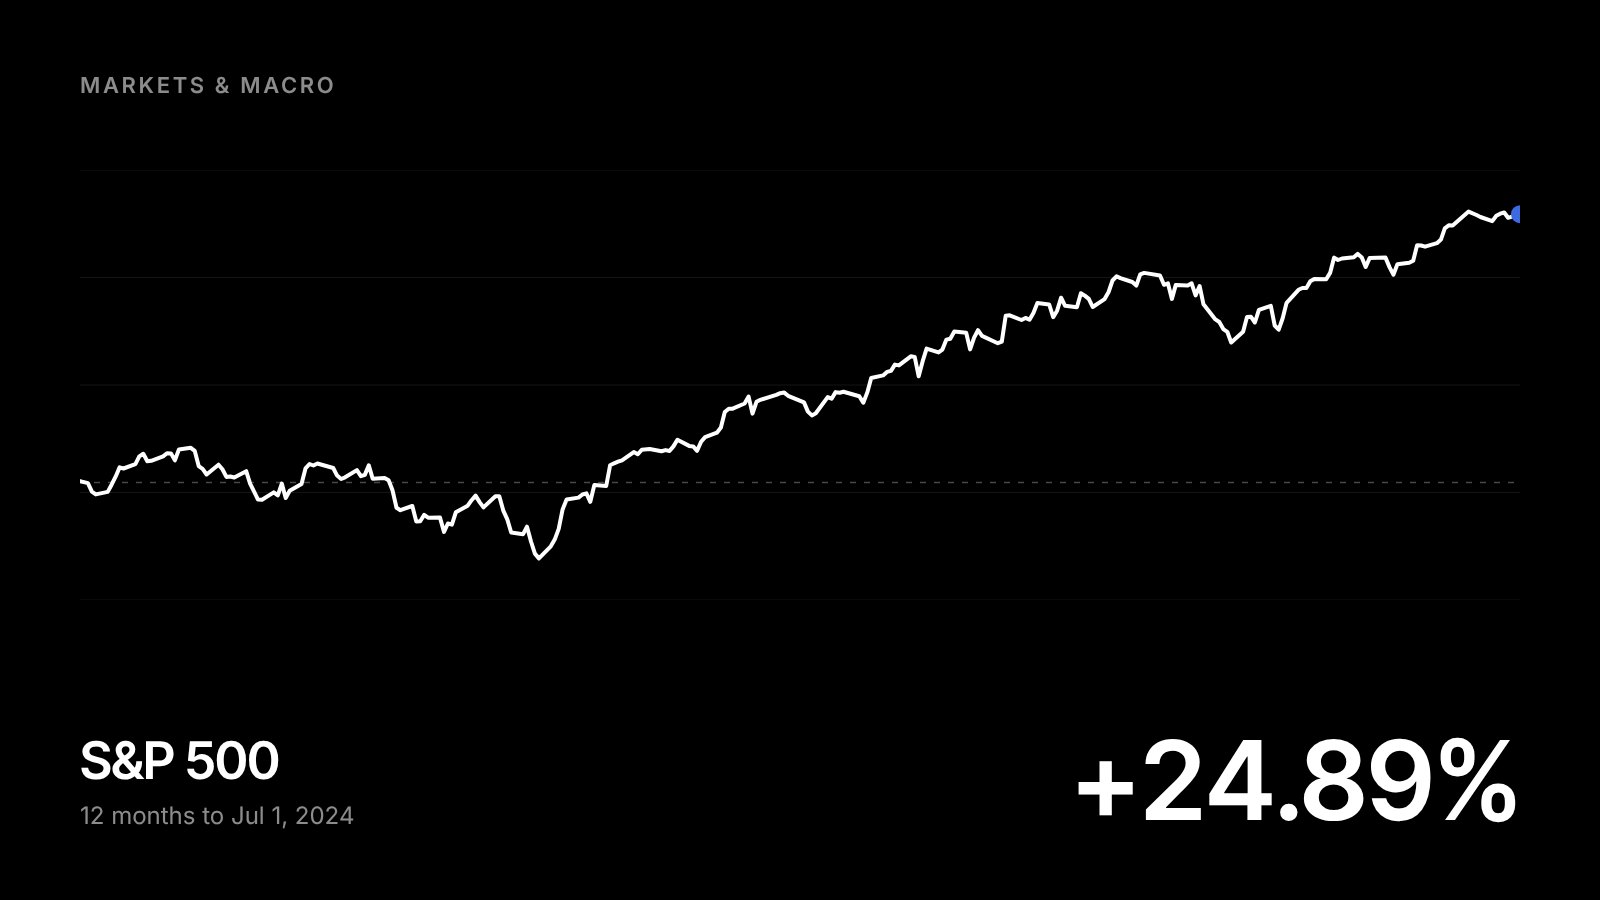
As we enter the second half of the year, it’s important for long-term investors to maintain perspective on the major events that have driven markets. Despite ongoing economic uncertainty, the stock market has experienced a strong rally as investors anticipate the first Fed rate cut and the rally in artificial intelligence stocks continues. During the first six months of the year, the S&P 500 gained 15.3% with dividends, the Nasdaq 18.6%, and the Dow Jones Industrial Average 4.8%. The 10-year Treasury yield declined from its April peak of 4.7% to 4.4%, allowing the overall bond market to be roughly flat on the year. International stocks have performed better as well, with developed markets generating 5.7% and emerging markets 7.7%.
This strong performance may have caught some investors off guard while others may not have been properly positioned to take advantage of the upswing across many asset classes. This is because market sentiment can often turn on a dime, especially when there is so much investor and media focus on short-term events. For example, the recession that was anticipated at the beginning of the year has not yet occurred and there are signs that inflation, which ran hotter than expected for a few months, is beginning to improve.
Of course, the market’s focus will now shift toward major events in the second half of the year. Perhaps the most notable is the upcoming presidential election. As investors prepare to cast their ballots in November, they will also wonder what each political party could mean for their portfolios and financial plans. Investors will also watch the timing and number of Fed rate cuts closely since lower rates are generally positive for both stocks and bonds.
While the outcome of these events is uncertain and introduces new risks, the first half of the year is a reminder that overreacting to day-to-day headlines, at the expense of long-term underlying trends, can often result in poor investment decisions. History shows that it’s important to separate our personal feelings around politics from our financial decisions in order to stay invested, diversified, and disciplined. Below are five key facts all investors should keep in mind to stay levelheaded through the rest of 2024 and beyond.
1. The market continues to reach new all-time highs
On its way to a 15.3% gain in the first half of the year, the S&P 500 has achieved over 30 new all-time highs. While this is positive, it can also make many investors nervous. When the market is in uncharted territory, it’s easy to worry that it may be “due for a pullback.”
The reality is that price swings are an unavoidable part of investing and the market will certainly pull back at some point. However, the timing of these declines is difficult if not impossible to predict. At the same time, major stock market indices will naturally spend a significant amount of time near record levels during bull markets, as shown in the accompanying chart. Trying to time the market tends to be counterproductive for this reason.
This year, artificial intelligence stocks – particularly Nvidia – have contributed greatly to market returns with the Information Technology and Communication Services sectors gaining 28.2% and 26.7%, respectively. However, other sectors have more recently begun to benefit as well with Energy, Financials, Utilities, and Consumer Staples all experiencing rallies of around 10%. All told, 10 of the 11 sectors are positive on the year. While it’s unclear where large-cap technology stocks may go from here, staying diversified allows investors to benefit from a wide variety of sectors.
2. With inflation cooling, the Fed is on track to cut rates later this year
Investors have been anticipating the first rate cut of the cycle since the beginning of the year. This has not only driven returns, but is one reason markets have swung so much when new economic data has caused expectations to shift.
The accompanying chart shows the possible path of the federal funds rate based on the Fed’s latest projections. At its last meeting, the Fed cited strong job gains and low unemployment as indicators of solid economic activity but emphasized that “inflation has eased over the past year but remains elevated.” Fortunately, the latest inflation data in May showed a significant deceleration that has preserved the possibility of a rate cut this year.
Many of the additional rate cuts that investors previously expected have simply been pushed into next year and will depend on the economic data over the next six months. Regardless of the exact timing and path of Fed rate cuts, these projections represent a reversal of the emergency monetary policy actions that began in early 2022.
3. Steadier rates support the bond market
| Rank in the year, best to worst | |||||||||
|---|---|---|---|---|---|---|---|---|---|
| Year | 1st | 2nd | 3rd | 4th | 5th | 6th | 7th | 8th | 9th |
| 2008 | 13.7 | 8.3 | 5.2 | −2.4 | −2.5 | −4.9 | −5.9 | −12.0 | −26.2 |
| 2009 | 58.2 | 29.8 | 21.7 | 18.7 | 12.9 | 11.4 | 5.9 | 5.9 | −3.6 |
| 2010 | 15.4 | 15.1 | 12.2 | 9.0 | 6.5 | 6.3 | 5.9 | 5.4 | 2.4 |
| 2011 | 13.6 | 10.7 | 9.8 | 8.1 | 7.8 | 7.3 | 6.2 | 5.0 | −2.0 |
| 2012 | 17.5 | 17.4 | 15.8 | 9.8 | 7.0 | 6.8 | 4.2 | 2.6 | 2.0 |
| 2013 | 7.4 | −1.4 | −1.5 | −2.0 | −2.6 | −2.7 | −5.3 | −8.3 | −8.6 |
| 2014 | 9.1 | 7.5 | 7.4 | 6.1 | 6.0 | 5.1 | 3.6 | 2.5 | −5.2 |
| 2015 | 3.3 | 1.5 | 1.2 | 0.8 | 0.5 | −0.7 | −1.4 | −4.5 | −14.3 |
| 2016 | 17.1 | 10.2 | 10.0 | 6.1 | 4.7 | 2.6 | 1.7 | 1.0 | 0.2 |
| 2017 | 14.7 | 10.3 | 7.5 | 6.4 | 5.4 | 3.5 | 3.0 | 2.5 | 2.3 |
| 2018 | 1.3 | 1.0 | 0.9 | 0.0 | −1.3 | −2.1 | −2.5 | −4.3 | −6.9 |
| 2019 | 15.0 | 14.5 | 14.3 | 10.1 | 8.7 | 8.4 | 7.5 | 6.9 | 6.4 |
| 2020 | 11.0 | 9.9 | 8.0 | 7.5 | 7.1 | 5.3 | 5.2 | 3.9 | 3.5 |
| 2021 | 6.0 | 5.3 | 1.5 | −1.0 | −1.0 | −1.5 | −1.8 | −2.3 | −9.2 |
| 2022 | −8.5 | −10.2 | −11.2 | −11.8 | −11.8 | −12.5 | −13.0 | −15.8 | −17.8 |
| 2023 | 13.4 | 11.1 | 10.9 | 8.5 | 6.4 | 5.5 | 5.0 | 4.1 | 3.9 |
| 2024 | 4.3 | 3.9 | 1.7 | 1.0 | 0.8 | 0.7 | 0.5 | 0.4 | −1.8 |
The path of interest rates has been highly uncertain over the past few years due to inflation, economic growth, and the Fed. Higher rates have defied the expectations of investors and economists, creating a challenging environment for the bond market, since rising rates push down bond prices.
After hotter-than-expected readings in the first quarter of the year, the latest Consumer Price Index data showed no change in overall prices in May for the first time in almost two years. Core CPI rose 0.2% in May, or 3.4% year-over-year, a healthy deceleration from the previous month’s 3.6% pace. Other data, such as the Personal Consumption Expenditures index that the Fed favors, and the Producer Price Index, have shown similar patterns.
These developments, along with new Fed guidance, have pushed rates lower in recent days, supporting bond prices. The Bloomberg U.S. Aggregate Bond Index, a measure of the overall bond market, is nearly flat on the year after declining as much as 4% in April. This is in sharp contrast to 2022 when bonds fell into a bear market during the historic jump in interest rates, before stabilizing and rebounding in 2023.
4. Many investors remain on the sidelines in cash
In times of market uncertainty, investors often seek the safety of cash. This has been true over the past several years as markets have swung due to the pandemic, geopolitical events, Fed rate hikes, inflation, gridlock in Washington, technology trends, and more. Additionally, interest rates on cash are at their highest levels in decades, making it appear that there are attractive “risk-free” returns.
While cash is important, it can become problematic when investors hold too much cash. This is because cash is not truly risk-free for two important reasons. First, inflation quietly erodes the purchasing power of cash over time. So even if yields appear to be high, the real value of your money could decline.
Second, the prospects for cash will only worsen if and when the Fed does begin to cut rates. Investors would be forced to reinvest their cash either at lower interest rates or in stocks and bonds whose prices would most likely have already risen.
5. The presidential election is heating up
Coverage of the presidential election is heating up. While elections are an essential way for Americans to help shape the direction of the country as citizens, voters and taxpayers, it’s important to vote at the ballot box and not with investment portfolios.
History shows that markets can perform well under both major political parties. As the accompanying chart shows, the economy and stock market have grown over decades regardless of who was in the White House. What mattered more across these periods were the ups and downs of the business cycle.
Of course, politics can impact taxes, trade, industrial activity, regulations, and more. However, not only do policy changes tend to be incremental, but also the exact timing and effects are often overestimated. Thus, it’s important to focus less on day-to-day election poll results and more on the long-term economic and market trends. Ideally, investors concerned about the impact of specific policies on their financial plans should speak with a trusted financial advisor.
The bottom line? Investors should keep these five factors in mind as we head into summer. As always, it’s important to maintain a long-term perspective to achieve investing goals. Working with a trusted financial advisor can help you navigate through an uncertain future and be prepared for changes in the economy and stock market through the rest of 2024.