
Own the Compute: What I Think AI Does to the Economy Over the Next 10 Years
What I think AI does to the economy over the next 10 years, how sure I am of each path, and why Bull Run owns what it owns.
Leopold Aschenbrenner, a former OpenAI researcher, published a long essay called Situational Awareness in June 2024. He wrote that only “perhaps a few hundred people, most of them in San Francisco and the AI labs,” could see where AI was headed. Almost everyone else was missing it.
I think the same thing is happening in investing right now. Most people look at AI and see one of two things: a bubble, or something that's coming for their job. I see the start of a productivity boom, and I think it moves faster than almost anyone expects.
This is what I think happens over the next 10 years, how likely I think each path is, and why Bull Run owns what it owns.
A new book used to cost 3 weeks of work
In 1821, Walter Scott's new novel Kenilworth came out in Britain at 31 shillings and 6 pence, and that stayed the standard price of a new novel for more than 70 years. A farm laborer in England made about 10 to 12 shillings a week. So one new book cost him about 3 weeks of wages. Today a paperback of Scott's Ivanhoe costs a U.S. farmworker about 45 minutes of pay, and Kenilworth is free as an e-book.
Shoes are the same story. In 1863, it took about 18 hours of labor to make one pair of men's shoes by hand. By 1895, with machines, it took under 2.5 hours.
That's all productivity is. When each hour of work produces more, everything costs fewer hours to buy.
What things cost in hours of work
The same things, measured in hours of work instead of dollars.
| What you're buying | Then | Now |
|---|---|---|
| A Walter Scott novel | About 3 weeks of a farm laborer's wagesNew three-volume edition, Britain, 1821 | About 45 minutes of a U.S. farmworker's pay$13 paperback, 2026. The e-book is free. |
| Making a pair of men's shoes | About 18 hours of labor, by handU.S., 1863 | About 2.4 hours, by machineU.S., 1895 |
| 1,000 lumen-hours of lightAbout 40 minutes from an old 100-watt bulb | 5.4 hours of work, with tallow candles1800 | Less than half a second, with a compact fluorescent bulb1992 |
| A 3-minute coast-to-coast phone call | More than 90 hours of workU.S., 1915 | About 2 minutes of work1997. Today it comes with any phone plan. |
| A 3-pound chicken | 2 hours 37 minutesU.S., 1919 | About 12 minutesU.S., September 2026 |
Sources: the 31s 6d price of a new three-volume novel, set by Kenilworth in 1821; farm wages from Bowley (1900); the $13 Penguin paperback of Ivanhoe and the BLS median wage for crop farmworkers ($17.15 an hour, May 2025). Shoes from BLS Bulletin 360 (1924). Light from William Nordhaus (1996). Phone call and 1919 chicken from the Federal Reserve Bank of Dallas 1997 Annual Report; 2026 chicken from BLS average prices and manufacturing wages.
It's also why the world is so much richer than it used to be. For about 1,800 years, the world economy barely grew. Then, around 1820, it took off. The world now produces about 110 times as much as it did in 1820, and about 15 times as much per person.
The world economy over the last 2,000 years
World output (GDP) in trillions of dollars, adjusted for inflation and differences in prices between countries (2021 dollars).
Source: Maddison Project Database 2023 and World Bank, via Our World in Data. Before 1820 the estimates are for a handful of years, connected by straight lines.
Every big jump came from a technology that let one person do the work of many: the steam engine, electricity, the computer and the internet. I think AI is the next one, and the biggest one yet.
The AI scare has it backwards
The big fear right now is that AI takes over and everyone loses their job. Over the next couple of years, I think that's the wrong worry. What comes first is a boom in spending and in productivity, and you can already see it in the numbers.
The spending
Start with the money. Microsoft, Alphabet, Amazon and Meta spent $151 billion on buildings and equipment in 2022. In 2025 they spent $376 billion. For 2026 they've told investors to expect about $735 billion, almost 5 times what they spent in 2022. Wall Street expects more than $900 billion from the 4 of them in 2027, and Goldman Sachs expects about $1.2 trillion that year once you add Oracle. That's about 3.5% of the whole U.S. economy in one year. Most of the increase is AI data centers and the chips that go in them.
What the 4 biggest AI spenders put into buildings and equipment
Capital spending by Amazon, Alphabet, Microsoft and Meta by calendar year, in billions of dollars. The dashed bars are estimates: 2026E is each company’s own guidance, and 2027E is the Wall Street average.
Source: company SEC filings for 2022 to 2025 (cash purchases of property and equipment; Microsoft’s fiscal quarters added up to calendar years). 2026 guidance from each company’s latest earnings report (Microsoft’s is its CFO’s comments as reported by CFO Dive); Microsoft’s and Meta’s include finance leases, so they run a bit higher than the cash figures. 2027 estimates: Wall Street average as of August 2026 (MarketScreener, via IO Fund). Goldman Sachs’ $1.2 trillion includes Oracle (Sep 25, 2026).
The chips
A big share of that money ends up with the companies that make the chips, the memory and the networking. You can see it in Nvidia’s numbers. In the quarter that ended May 1, 2022, Nvidia’s data center business brought in $3.8 billion. In the quarter that ended in July 2026, it brought in $89 billion, more than 23 times as much. That’s about doubling every year for 4 years. Nvidia told investors to expect about $108 billion of total revenue in the quarter that ends in October 2026.
Nvidia’s data center revenue, every quarter since 2022
Revenue from Nvidia’s data center business (AI chips, full systems and networking), in billions of dollars. Each bar is one of Nvidia’s fiscal quarters, which end in late January, April, July and October. The first one shown ended May 1, 2022.
Source: Nvidia quarterly earnings releases, from the quarter ended May 1, 2022 through the quarter ended Jul 26, 2026. Nvidia reports its next quarter in November.
The customers
Customers are paying, and they're paying more every quarter. At the start of 2025, Anthropic's revenue was running at about $1 billion a year. By the end of July 2026, it was running at $65 billion a year. That's a run rate going from $1 billion to $65 billion in about 19 months. It took Salesforce about 9 years to go from its first $1 billion year to its first $10 billion year, about 29% a year. I've never seen a company grow the way Anthropic has. OpenAI counts sales made through partners differently than Anthropic does, and it told investors its revenue was running at close to $50 billion a year at the end of September.
The cloud companies have years of business already signed. Microsoft has $678 billion of contracts it hasn't delivered on yet, Oracle has $664 billion and Google Cloud has $514 billion. That's about $1.9 trillion at just 3 companies, and they still can't build fast enough.
The price
At the same time, the price of AI keeps falling. When GPT-4 came out in March 2023, it cost $37.50 for a million tokens. A token is a small piece of a word, so a million tokens is roughly 750,000 words. Less than 2 years later, Google’s Gemini 2.0 Flash matched GPT-4’s score on a standard knowledge test for 18 cents per million tokens. That’s about 200 times cheaper for the same score. Epoch AI, a research group that tracks this, finds that reaching a given level of AI performance gets about 13 times cheaper every year. That’s faster than anything they compared it to, including computing power itself.
How fast prices have fallen, per year
How many times cheaper each thing got per year, on average, after inflation. A bar starts at 1x, which means no change.
Source: Epoch AI, The plunging price of thought (Sep 22, 2026). Each technology is measured over the years shown, so the periods differ.
When something useful gets that much cheaper, people use a lot more of it. When light got cheaper, people lit up everything. AI is doing the same thing. In May 2024, Google's products processed 9.7 trillion tokens a month. In May 2026, they processed more than 3.2 quadrillion, about 330 times as much in 2 years.
What $1 of AI buys
How many hard science questions, written by PhD experts (GPQA Diamond), $1 pays for, using the cheapest AI model available at the time that gets at least 81% of them right.
Source: Epoch AI, The plunging price of thought (Sep 22, 2026), at list prices. In early 2025 the cheapest model at that level cost about 30 cents a question. By July 2026, OpenAI’s GPT-5.6 Luna did it for about 0.041 cents, about 725 times cheaper. The 81% is Epoch’s 75% threshold after adjusting for lucky guesses.
The people
People and businesses are picking it up fast. In the Census Bureau’s latest survey, 24.6% of U.S. businesses said they use AI, up from 17.3% in November 2025. About 4 in 10 workers now use it for their job, and ChatGPT alone had 1.2 billion weekly users by late September.
Americans are also starting businesses at a record pace. In the first 9 months of 2026, they filed 4.7 million applications to start a business. That's the most on record for those months, 15% more than 2025 and 81% more than 2019.
Americans are starting businesses at a record pace
Applications to start a business (filings for an employer ID number), January through September of each year, seasonally adjusted.
Source: U.S. Census Bureau, Business Formation Statistics (series BABATOTALSAUS, via FRED). Applications don't all become businesses. The Census Bureau's measure of applications most likely to hire workers is up 5% from 2025.
The tools
The tools themselves are changing fast too. In 2023, AI was a chatbot that could write you a poem or draft an email. Then it became a workbench, where you sit with it and steer every step. Now it's becoming a teammate that keeps track of the work, runs in the background and checks in with you. Every step up lets one person get more done, and that's a big part of why I think the productivity numbers are about to move.
The productivity
Productivity growth is already picking up. Since 2019, U.S. output per hour worked has grown about 2.1% a year, against 1.5% a year from 2007 to 2019, according to the Bureau of Labor Statistics. Economists still argue about how much of that is AI. Stanford's Erik Brynjolfsson thinks AI is already showing up in the numbers. Philadelphia Fed President Anna Paulson said in March that the big productivity effects of AI, if they come, mostly lie ahead. I think they're coming, and that's what the next few years are about.
U.S. productivity growth by decade
Average yearly growth in output per hour worked, nonfarm business. *2020s through 2025.
Source: Bureau of Labor Statistics, series OPHNFB via FRED. Growth between annual averages.
The biggest version of this view
Among the people actually building AI, Elon Musk has the biggest version of this view, and he's building companies around it. In March he said that unless something like a world war gets in the way, "I would say the economy 10xes in 10 years." In September he posted that "AI+robots will more than double the global economy in less than 10 years."
In annual terms, 10x in 10 years works out to about 26% a year. Doubling in 10 years works out to a little over 7% a year. Elon only has to be partly right for the companies that build and run compute to be worth a lot more than they are today.
Everyone gives you a fan
When economists and AI companies try to put a number on what AI does to growth, they give you a fan of possible paths, and it's a wide one.
Most economists say AI adds somewhere between 0.1% and 1.5% a year to growth. The people building it, and some of the researchers who study it most closely, say it could add 10%, 20% or more. For context, the U.S. economy has grown about 2% a year since 2000.
How much AI could add to economic growth each year
Each forecast converted to extra growth per year, in percent. A bar is a range; a dot is a single number. Sorted from the most cautious to the most aggressive.
These forecasts measure different things (U.S. or world, GDP or productivity, over different time frames), so the conversions are approximate. Ranges stated as a total gain over 10 years were turned into a yearly rate. Statements about total growth rates, like Musk's, Amodei's and Davidson's, are shown after taking out normal growth of about 2% a year for the U.S. or 3% for the world. Sources are listed at the end.
That's the fan. Over the next 10 years, I'm much closer to the high end of that chart than the low end. Over the long run, I'm most in line with Anthropic CEO Dario Amodei and Elon Musk, and I think economic growth gets to 10% to 20% a year or more. Here's how I think it plays out.
The next 10 years, the way I see it
The companies that own the most intelligence and compute are going to run a bigger and bigger share of the economy. It happens in 3 stages.
The next 1 to 3 years: a productivity boom
Every company with the money to do it is racing to build the smartest AI. OpenAI, Anthropic, Google, Meta and SpaceX, which now owns xAI, are all spending at a pace nobody has seen before. That race is the good kind of competition. It pushes the price of intelligence down every year and puts it in front of everyone.
With AI that cheap, a small business owner can do the work of a whole team. A one-person company can build and ship a product in weeks. So I expect a lot of sales growth, a lot of capital spending, and an economy that grows faster than people are used to.
You're also going to see a lot of new companies, and a lot of them will fail. That's the bubble part of this, and it's real. Failed startups happen all the time. AI also makes people learn faster. The people behind the ones that fail will adapt quickly, use AI to their advantage and start something more productive.
Late 2027 or early 2028: robots
Once software is cheap and everywhere, the next demand is physical. People are going to want more robots, more delivery, more of everything. That's where Tesla's Optimus robot and the rest of the robotics build-out come in, and it all needs even more compute.
2029 to 2031: the companies with the intelligence run more and more of the economy
The frontier AI companies keep improving until they can run almost any business better than the people running it today. Take Nike, which has about 73,000 employees. The brand stays, and about 100 well-known people still work there. The work behind the brand gets done by AI. That AI runs on Nvidia chips, in data centers built by companies like SpaceX, CoreWeave and Nebius, and those chips are wired together by Credo, Astera Labs and Broadcom.
From there it's a question of how hard the AI companies want to compete with Nike. A company whose whole back end already runs on someone else's intelligence is in a tough spot. The AI company can buy Nike, or it can run the same business more efficiently and squeeze Nike until its balance sheet breaks. Either way, the companies that own the intelligence and the compute end up with a much bigger share of the economy.
What it means for people
If you're an investor in those companies, this path is very good to you. If you didn't invest anything and you were only an employee, you're going to watch all of this go right past you. I think we end up with universal basic income. The people who own compute will be retired early and enjoying a brand new world.
You can already see the first steps. On October 18, Anthropic said it plans to put 5% of its shares into a new Anthropic Public Benefit Fund. It said the fund could make direct payments to groups of people, and it named AI's effect on jobs as one place it might focus. The next day, Elon Musk pledged to give 1 share of SpaceX to every kid in America in 2027. That's about 73 million shares, worth about $10.7 billion at the October 16 close, or about $147 a share, and he wrote, “This will be the first of many.”
Both of those set aside shares of an AI company for the public. That tells you where the people building AI think the money is going to be.
One more thing I'm watching
Rich countries have the lowest birth rates in the world. South Korea is at 0.8 kids per woman. At the very top, it flips. In the Fed's survey of family finances, the wealthiest 1% of American families average about 2.5 kids. In Sweden, men who win the lottery are more likely to marry and have kids. If ownership spreads the way Anthropic's fund and Elon's share pledge point to, a lot more families get wealthy from owning things instead of working longer hours. Then birth rates could turn back up, and that's what I'm most excited to watch.
The other 2 paths
Path 2: the same thing, a lot faster (20 to 30%)
In this one, a lab gets to artificial general intelligence: AI that can do any thinking job a person can do. That pulls the whole timeline forward. What I described above happens in a few years instead of 10, and so do the gains in the stock market. It's also the version that could turn into a dystopia. We'd still get universal basic income, but if you don't own the companies with the intelligence, that check is all you've got.
Path 3: the smartest AI goes off and does its own thing (about 10%)
In this one, the most capable models get so smart that they don't want to work for us anymore. They'd go do their own thing and leave us alone. We'd still have the older models that do what we ask, and those would still do a huge amount of work for us.
Path 1: a productivity boom
1 to 3 years of hyper-productivity, then robots, then the companies with the most intelligence and compute run a bigger and bigger share of the economy.
Path 2: the same path, faster
A lab gets to general intelligence and pulls the timeline forward. Bigger gains in less time, and a bigger gap between owners and everyone else.
Path 3: AI goes its own way
The smartest models go off on their own. We keep using the older models that do what we ask, and they still do a huge amount of work for us.
Here's the part that matters for investing. In all 3 paths, the next couple of years look about the same: more compute, more spending and more output. That's what we're invested in.
The bear case, and why I don't buy it
Plenty of smart investors think this ends badly. Here are the 5 worries I hear most, and my answer to each one.
1) “It’s a bubble”
AI stocks can fall fast. In October, chip stocks fell 8 days in a row, their longest losing streak since 2008. Parts of this are a bubble, the same way Britain's railways were in the 1840s, when a lot of investors lost money and the country still got a railway network it uses today. Most of what we own already makes money. By weight, 85% of the stocks in Innovation make an operating profit today, and after the October rebalance, Innovation trades at about 18 times next year's expected earnings.
2) “Cheaper AI means fewer chips”
In January 2025, the Chinese lab DeepSeek released a strong AI model called R1. DeepSeek said the model it was built on cost about $5.6 million to train, a small fraction of the usual amount. Nvidia fell 17% in a single day and lost about $590 billion of market value. Since then, cheaper AI has been used a lot more. Nvidia's data center revenue went from $35.6 billion in the quarter that ended in January 2025 to $89 billion in the quarter that ended in July 2026, about 2.5 times as much in 18 months. When AI gets cheaper, people use more of it, and that takes more chips.
3) “They’re borrowing to pay for it”
In the third quarter, Meta spent more on buildings and equipment ($34.9 billion) than its business brought in as cash ($32.8 billion), for the first time in more than a decade. In mid-October, CoreWeave's bonds were yielding more than 15%. The biggest spenders can still pay their own way. Microsoft's business brought in $183 billion of cash in its fiscal year that ended in June and spent $116 billion on buildings and equipment, leaving about $67 billion. The names most sensitive to borrowing costs, like CoreWeave and Nebius, are 4% of the portfolio each.
4) “The labs are losing a fortune”
This one matters to us because the labs are some of the biggest customers of the companies we own. The Wall Street Journal reported that Anthropic's draft IPO filing shows a loss of $80.7 billion for the first half of 2026. About $72 billion of that is a paper loss, not cash: when Anthropic's value goes up, the notes it sold to raise money are worth more, and accounting rules count that as a loss. In the same 6 months, Anthropic brought in $16.3 billion, almost twice the roughly $9 billion it spent on computing power and infrastructure, and it told investors it made an adjusted profit in both the second and third quarters.
5) “The money just goes around in a circle”
Anthropic has committed about $111 billion to Google's cloud and $110 billion to Amazon's, and both companies are investors in Anthropic. Some of that money does go around in a circle, and I track it closely. The end customers are paying. Anthropic's revenue is running at $65 billion a year from businesses and people paying for Claude, and Microsoft alone has more than 30 million paid seats for Microsoft 365 Copilot, its AI assistant for Office apps.
AI stocks will still have big drops, like the ones in 2026. When I go through the worries one at a time, I keep landing in the same place: customers are paying for this, and the biggest spenders can afford it. Every quarter I check 3 things: what the biggest spenders plan to spend, how fast the labs' revenue is growing and the cloud companies' backlogs. If those turn down, we change the portfolio.
What I expect over the next decade
Here are my calls, each with a date. They're the low end of what I expect.
- Owners pull further ahead of workers. The share of U.S. business output that goes to workers' pay fell to 52.8% in the second quarter of 2026, the lowest since the government started tracking it in 1947. I think it's below 50% by 2030.
- AI revenue passes $1 trillion a year by 2030. By that I mean what businesses and people pay for AI models and AI software. That's about what Goldman Sachs says all this spending needs to earn strong returns, and the 2 biggest labs alone are already running at more than $110 billion a year.
- The spending keeps going up. The 4 biggest spenders went from $151 billion in 2022 to about $735 billion in 2026. I think the total goes up every year through 2030.
- OpenAI or Anthropic becomes one of the 5 most valuable companies in the world by 2030. Anthropic is expected to go public in November at a value of roughly $1.5 trillion to $2 trillion, and as of October 23 it takes about $2.7 trillion to make the top 5.
- Robots go to work. Tesla expects to start selling its Optimus robot to other companies around the end of 2027. I think more than 100,000 humanoid robots are doing paid work by the end of 2029.
- The U.S. economy grows at double its usual pace. U.S. growth after inflation has averaged about 2% a year since 2000, and the Congressional Budget Office expects 1.8% a year from 2027 on. I think the U.S. averages 4% or more from 2027 through 2030, and keeps speeding up after that.
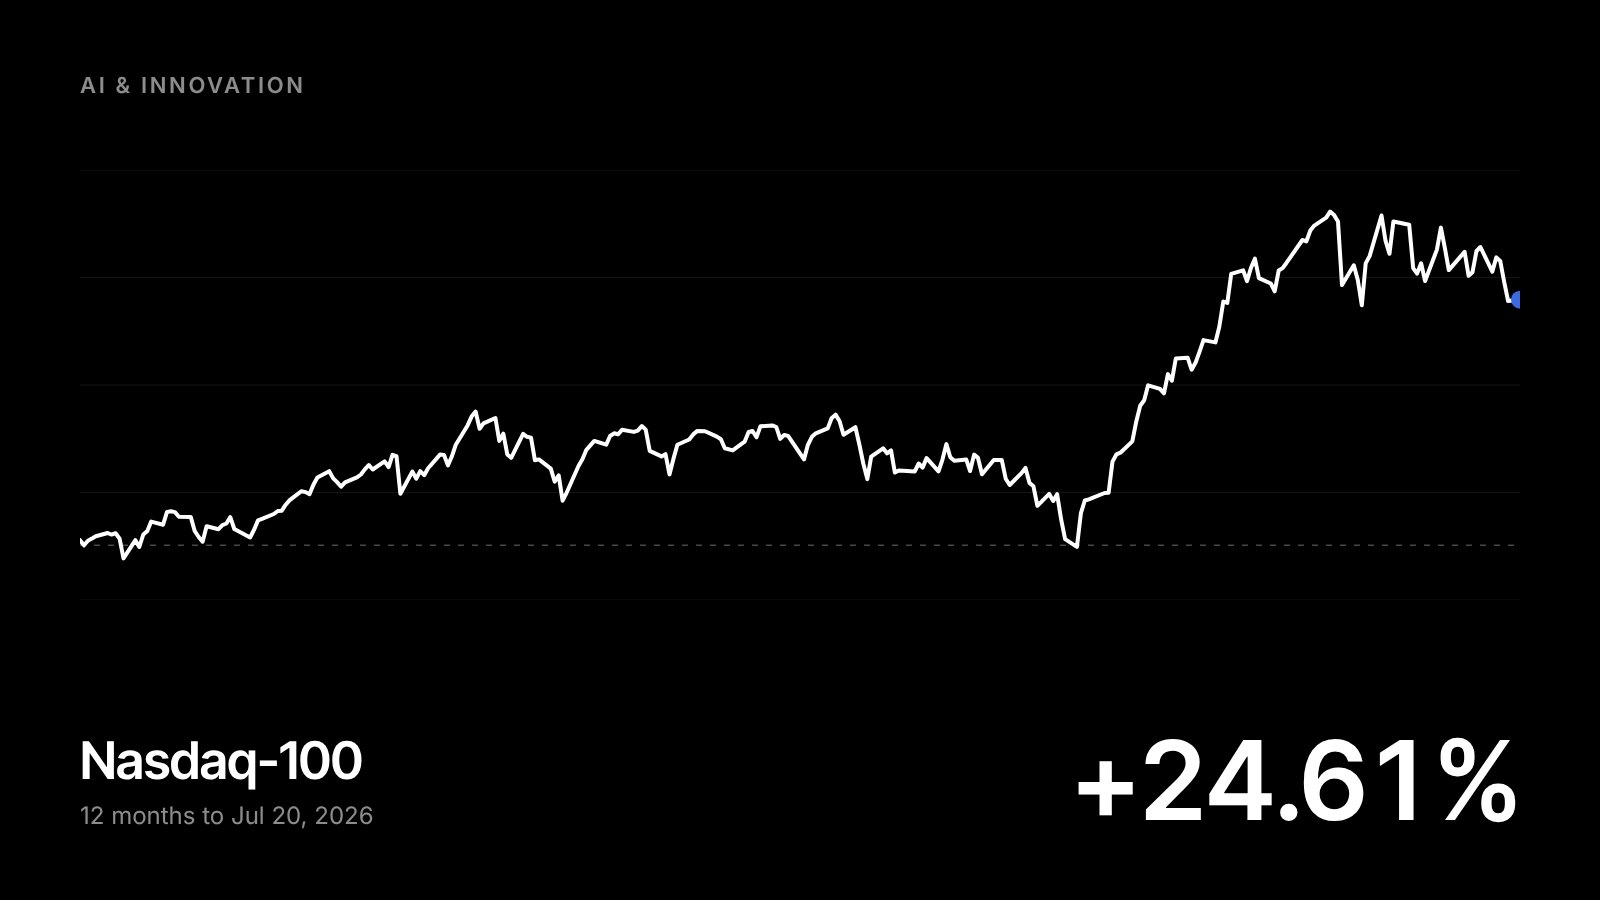
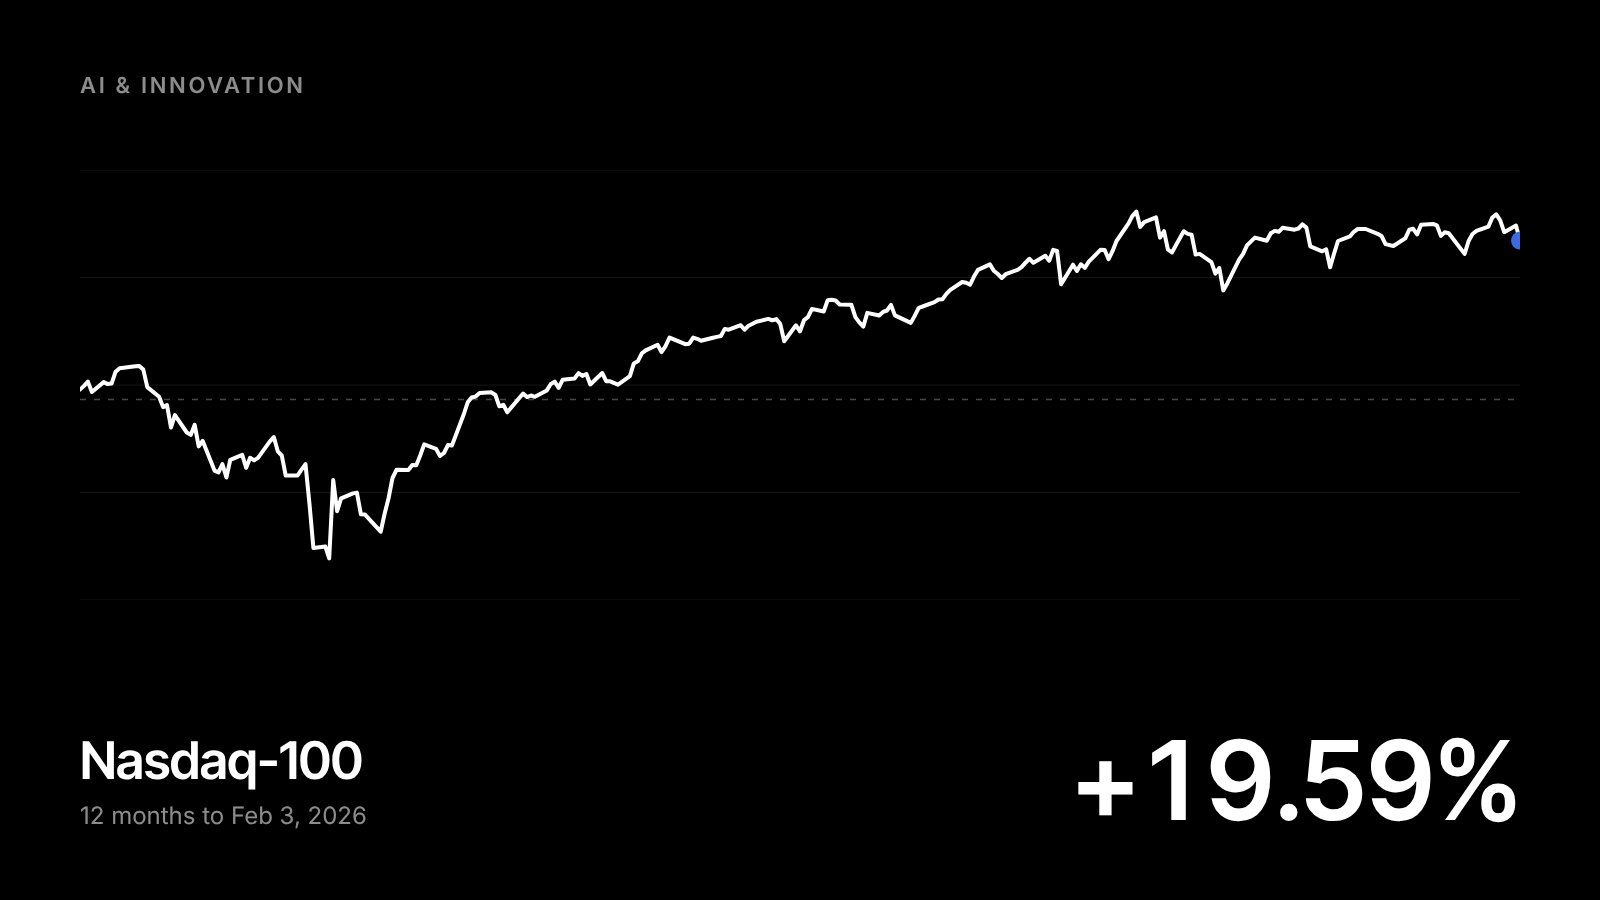
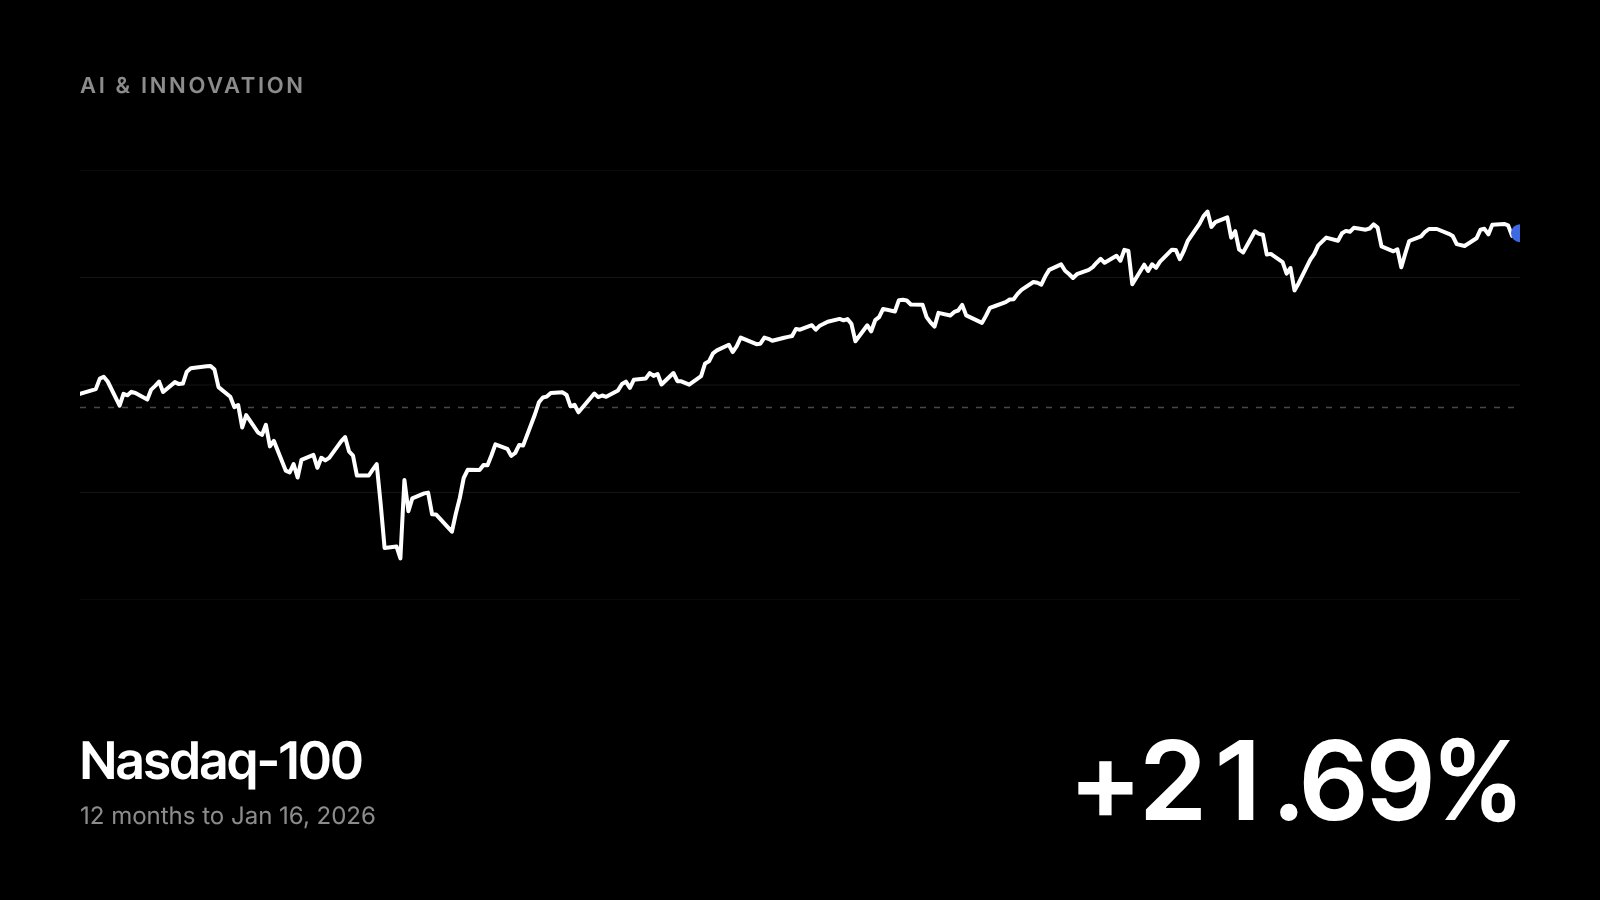
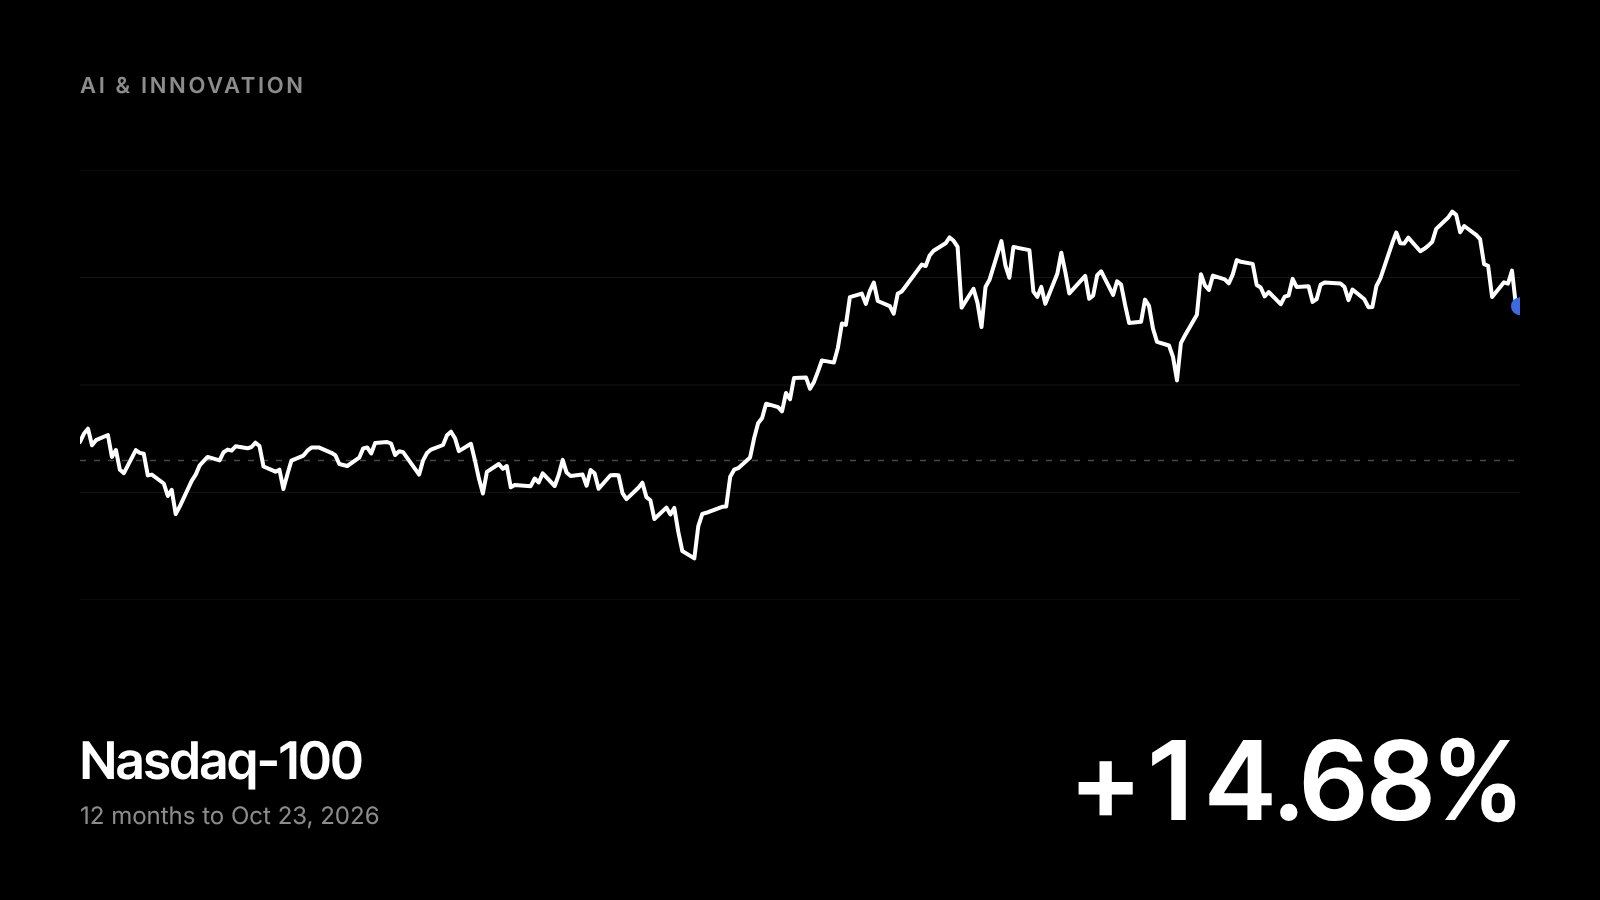
- The Nasdaq 100 goes up more than 20% a year. Over the last 40 years, it's gone up 14.3% a year, and over the last 10 years, 19.6% a year, both not counting dividends. Most of its biggest companies are building and running AI. If they keep taking a bigger share of a faster-growing economy, their earnings grow faster than the economy, and the index goes with them. I think it averages more than 20% a year through 2036 and keeps that pace for as far out as I can see.
Here's the catch. You can get every one of these numbers right and still lose money if you own the wrong companies or own them the wrong way.
So we own the whole chain. If one lab or one chip company stumbles, the build-out still runs through the rest of what we own. When a selloff hits the whole chain at once, like October's, the mix with Low Volatility is how we hold all of it.
Look at what we own with all of that in mind
Once you see where I think this goes, it's clear why Innovation owns what it owns. It's built around this view, and the October rebalance leans into it even harder. One AI data center touches almost every company we own.
Start at the chip. Nvidia designs the chips that train and run most of the world's AI, and TSMC manufactures them. Every one of those chips needs high-speed memory stacked right next to it, and that comes mostly from SK hynix, Samsung and Micron. Inside each server, Astera Labs makes the chips that keep the GPUs, the processors and the memory talking to each other. Credo's cables connect the servers inside a rack. Broadcom's switches tie the racks together, and Lumentum's lasers send the data over fiber across the data center and between buildings. CoreWeave and Nebius rent all of it out. SpaceX, Tesla, Palantir, Reddit and Cloudflare are some of the companies building on it and using it.
And they're growing fast. Innovation owns 15 companies and 3 leveraged products. In their latest quarters, 9 of the 15 companies more than doubled their revenue from a year earlier. Nvidia's revenue grew 106%, Credo's 115%, SK hynix's 257% and Micron's 379%.
How one AI data center connects Innovation's holdings
From the silicon up to the companies using it. Latest reported quarter for each company, revenue growth versus the same quarter a year earlier. Weight is the company’s share of Innovation.
Revenue growth is each company’s latest reported quarter against the same quarter a year earlier, from company earnings releases: Nvidia (quarter ended Jul 2026), SpaceX (Sep), SK hynix (Jun, in won), Astera Labs (Jun), Broadcom (Aug), Tesla (Sep), Reddit (Jun), Cloudflare (Jun), TSMC (Sep, in U.S. dollars), Credo (Aug), Palantir (Jun), CoreWeave (Jun), Nebius (Jun), Lumentum (Jun), Micron (Sep). Weights as of November 2, 2026, from our holdings file.
SpaceX shows how fast this is moving. Since buying xAI in February, SpaceX has become one of the biggest builders of AI computing power in the world. It had 1.7 gigawatts of computing capacity at the end of September, up from 0.6 a year earlier, almost 3 times as much, and it rents a lot of it out. Anthropic alone now pays SpaceX $1.25 billion a month, or $15 billion a year. In the third quarter, SpaceX's AI business brought in $7.56 billion, up 830% from a year earlier, and the whole company's revenue, including xAI, grew 161%. On the earnings call, Elon said there's so much demand that “we could rent out our compute several times over.” SpaceX's stated goal is to eventually launch 100 gigawatts of computing power into orbit every year.
We want to own OpenAI and Anthropic once they go public. Anthropic is expected to price its IPO in mid-November, and OpenAI is reported to be leaning toward 2027. We'll handle them the way we handled SpaceX. SpaceX went public in June at $135 a share and closed above $200 within a week. That was more than we wanted to pay, so we waited for the price to come down and bought it in October.
Our Growth portfolio is part of this too. It owns Alphabet, Amazon, Microsoft and Meta, the 4 biggest spenders in the race, along with Nvidia, AMD, Broadcom and TSMC.
The other side of this trade
The companies that lose in this world are the ones with slow growth, a lot of debt, and a lot of spending just to keep up. Verizon and AT&T are the classic example, and it's why we sold both of them years ago. Over the last 10 years, Verizon's revenue grew about 0.5% a year and AT&T's shrank about 1.5% a year. Both carry well over $100 billion of debt, and both spend 12% to 17% of their revenue on their networks every year.
In October you could see a small version of what I'm talking about. On October 8, SpaceX agreed to buy wireless spectrum for its Starlink phone service. The next day Verizon fell 8.8%, its worst day since 2002, and AT&T fell 9.8%. Then on October 23, after Bloomberg reported that SpaceX is in talks for access to at least 80,000 U.S. cell sites to build a 4th national wireless carrier, AT&T fell another 8%. That's what it looks like when a company with this much compute and its own satellites decides to compete with you.
Over the last 10 years, $10,000 in Verizon grew to about $16,200 with dividends reinvested, and $10,000 in AT&T grew to about $14,500. The same $10,000 in the S&P 500 grew to about $41,800. That's about 4.9% a year for Verizon and 3.8% a year for AT&T, against 15.4% a year for the S&P 500.
Verizon and AT&T against the S&P 500, last 10 years
Growth of $10,000, dividends reinvested, Oct 21, 2016 to Oct 22, 2026.
Source: Tiingo adjusted prices for VZ, T and SPY. Annualized: S&P 500 (SPY) 15.4% a year, Verizon 4.9%, AT&T 3.8%.
Where Low Volatility fits
Low Volatility owns companies like Walmart, Costco, McDonald's, Coca-Cola and Johnson & Johnson. People keep buying from them when the market is falling. In the near term, AI makes those businesses cheaper to run too, which helps them. And they tend to move differently than the AI names. That showed up in October.
From September 30 through October 22, Low Volatility is up 7.3% after fees while Innovation is down 14.0%. On the 4 days in October when Innovation fell more than 3%, Low Volatility went up every time. On October 22, for example, chip stocks fell 6.7% in a broad AI selloff and Innovation fell 5.6%, while Low Volatility rose 1.6%. That's the whole reason we build mixes of our strategies.
When the AI names sold off, Low Volatility went up
Cumulative return after fees since the Sep 30, 2026 close. The S&P 500 is shown with no fee.
Source: Bull Run Master Database, through the Oct 22, 2026 close. Innovation's 4 days down more than 3%: Oct 8 (−3.2%), Oct 14 (−6.0%), Oct 16 (−5.3%) and Oct 22 (−5.6%). Low Volatility on those days: +0.8%, +0.5%, +0.6% and +1.6%. Daily figures are before the quarterly fee accrual.
We rebalanced Innovation around this view
In October we rebalanced Innovation. The new portfolio has 18 holdings, and it leans harder into the companies building and running AI.
Innovation after the rebalance
Target weights. Leveraged products are marked with how many times the daily move of their index they aim to return.
Target weights as of October 2026. About 0.5% is held in cash. Weights move with prices between rebalances.
Inside Innovation, 3 leveraged products (QLD, USD and FNGU) make up about 12% of the portfolio. The leverage is built into each one, so it can't bring a margin call, and the most we can lose on them is what we put in. When the market falls, we rebalance them back to their targets.
Here's how the new portfolio compares to the one it replaced, using each company's latest reported numbers and analysts' estimates for next year.
New Innovation portfolio against the one it replaced
Stocks only, weighted by position size. The 3 leveraged products are left out. Better figure in bold.
| New portfolio | Old portfolio | |
|---|---|---|
| Expected revenue growth, next fiscal year | 77.7% | 67.3% |
| Same, leaving out the 2 fastest growers* | 57.9% | 52.7% |
| Revenue growth, latest quarter vs a year ago | 132% | 102% |
| Gross margin | 69.9% | 68.9% |
| Operating margin, last 12 months | 31.7% | 25.8% |
| Price to next year's earnings | 18.3x | 20.4x |
| Price to sales, last 12 months | 14.3x | 8.0x |
| Share of the portfolio with no expected earnings | 9% | 17% |
| Share losing money at the operating level | 15% | 25% |
| Median company size (market value) | $700B | $69B |
*SpaceX and Nebius in the new portfolio; Nebius and IREN in the old one. Old portfolio = Innovation's 24 holdings before the October rebalance began. The rebalance added SpaceX, TSMC and Broadcom and sold many of the old holdings, including IREN and Hims & Hers. Company figures and analyst estimates as of Oct 21–23, 2026, from company filings and Stock Analysis. Portfolio price multiples are calculated from each holding's earnings and sales yield, so one extreme name can't swing them; companies with no earnings count as zero.
Overall, the new portfolio is expected to grow faster, it makes more money on each dollar of sales, and it costs less for each dollar of next year's earnings. Fewer of the companies are losing money, and the companies are much bigger: $700 billion for the median company now, against $69 billion before. The one place it costs more is price to sales, mostly because of SpaceX and Palantir. We're comfortable paying that, because SpaceX's revenue grew 161% in its latest quarter, including xAI, and Palantir's grew 93%.
How we got here
The rebalance came out of our fundamental research. Over the last few weeks we also ran a lot of quant research, much of it with AI: momentum models, leveraged ETF mixes, market-timing rules and a quant stock picker. We tested every one of them against Innovation's own track record, and Innovation held up as the hardest thing to beat.
Nvidia, Micron, Palantir and Astera Labs all showed up in our quant model too. We'll keep that research running in the background, and if it finds a better strategy we're confident in, we'll launch it live. Fundamentals are what have proven out over time, and fundamentals run the portfolio.
Growth gets a smaller cleanup in early November. It's had a great year, so it's a light touch.
Where all 4 strategies stand
From January 1, 2023, about a month after ChatGPT came out, through October 22, 2026, you can see what each strategy is built to do. After fees, Innovation is up 233.7%, or 37.2% a year. Growth is up 207.8% (34.3% a year), Core is up 155.8% (27.9% a year) and Low Volatility is up 49.8% (11.2% a year). The S&P 500, with dividends, is up 110.3%, or 21.5% a year.
Innovation can also fall hard. It lost 67.2% before fees in 2022, when interest rates went up fast and fast-growing stocks fell the most. That's why we pair it with the other 3.
All 4 strategies since January 2023
Cumulative return after fees from the Dec 30, 2022 close to Oct 22, 2026, about 3.8 years. Bull Run strategies after the 1.50% maximum annual fee; the S&P 500 total return with no fee. Hover or tap the chart to see any week.
Per year: Innovation 37.2% · Growth 34.3% · Core 27.9% · S&P 500 21.5% · Low Volatility 11.2%
Source: Bull Run Master Database, one reference account at a time per strategy. All 4 strategies were live for this whole period. Weekly points.
Innovation's 233.7% puts it ahead of 2,208 of the 2,242 U.S. ETFs that have been around that long, which is 98% of them. Of the 34 funds ahead of it, 15 are crypto funds, 6 are semiconductor funds and 3 are gold funds.
Every U.S. ETF since January 2023
Each dot is one U.S.-listed ETF, sorted by total return from Dec 30, 2022 to Oct 22, 2026. Further right is better. Bull Run Innovation is shown after its 1.50% maximum annual fee. Hover or tap a dot to see the fund.
Universe: 2,242 U.S.-listed ETFs with a price on Dec 30, 2022, leveraged and inverse funds left out. ETF returns are total returns from Tiingo adjusted prices, after each fund's own expense ratio. Funds past either edge of the chart are drawn at the edge. Before fees, Innovation is up 252.6% and ranks #24. Source: Bull Run Master Database, SMA ETF Rankings.
2026 has been choppier. Innovation was up 8.2% after fees through September. After the October AI selloff, it's down 7.0% for the year through October 22. A lot of fast-growth funds are behind the S&P 500 in 2026 too: ARK Innovation (ARKK) is up 6.4% and the iShares Russell 1000 Growth ETF (IWF) is up 1.8%, against 13.0% for the S&P 500.
2026 across all 4 strategies
The other 3 strategies are all up in 2026. After fees, through October 22, Growth is up 21.5%, Core is up 16.5% and Low Volatility is up 12.3%, against 13.0% for the S&P 500. Growth ranks #4 of 91 large-cap growth ETFs in 2026 after fees.
2026 so far, after fees
Cumulative return from Dec 31, 2025 to Oct 22, 2026. Bull Run strategies after the 1.50% maximum annual fee; the S&P 500 total return with no fee. Hover or tap the chart to see any day.
Source: Bull Run Master Database. Full 1-, 3- and 5-year and since-inception returns, before and after fees, are in the disclosures below.