
A Rare Capitulation Signal From the Market
A breadth and momentum capitulation indicator hit -4.33, a reading seen only 13 other times since 1929. What happened after.
Key points:
- A breadth and momentum indicator plunged to one of the lowest levels in history, suggesting capitulation.
- Similar oversold conditions saw the S&P 500 rally over the following six months in all but one case.
One capitulation indicator suggests a stock market rally
Several years ago, an anonymous source on the social media platform X, known as @MrBlonde_macro, shared a compelling capitulation indicator that caught the attention of market participants.
I recreated the indicator using a slightly different dataset while preserving its core logic. The model blends market breadth and price momentum indicators (see chart for components) to pinpoint capitulation or deeply oversold conditions.
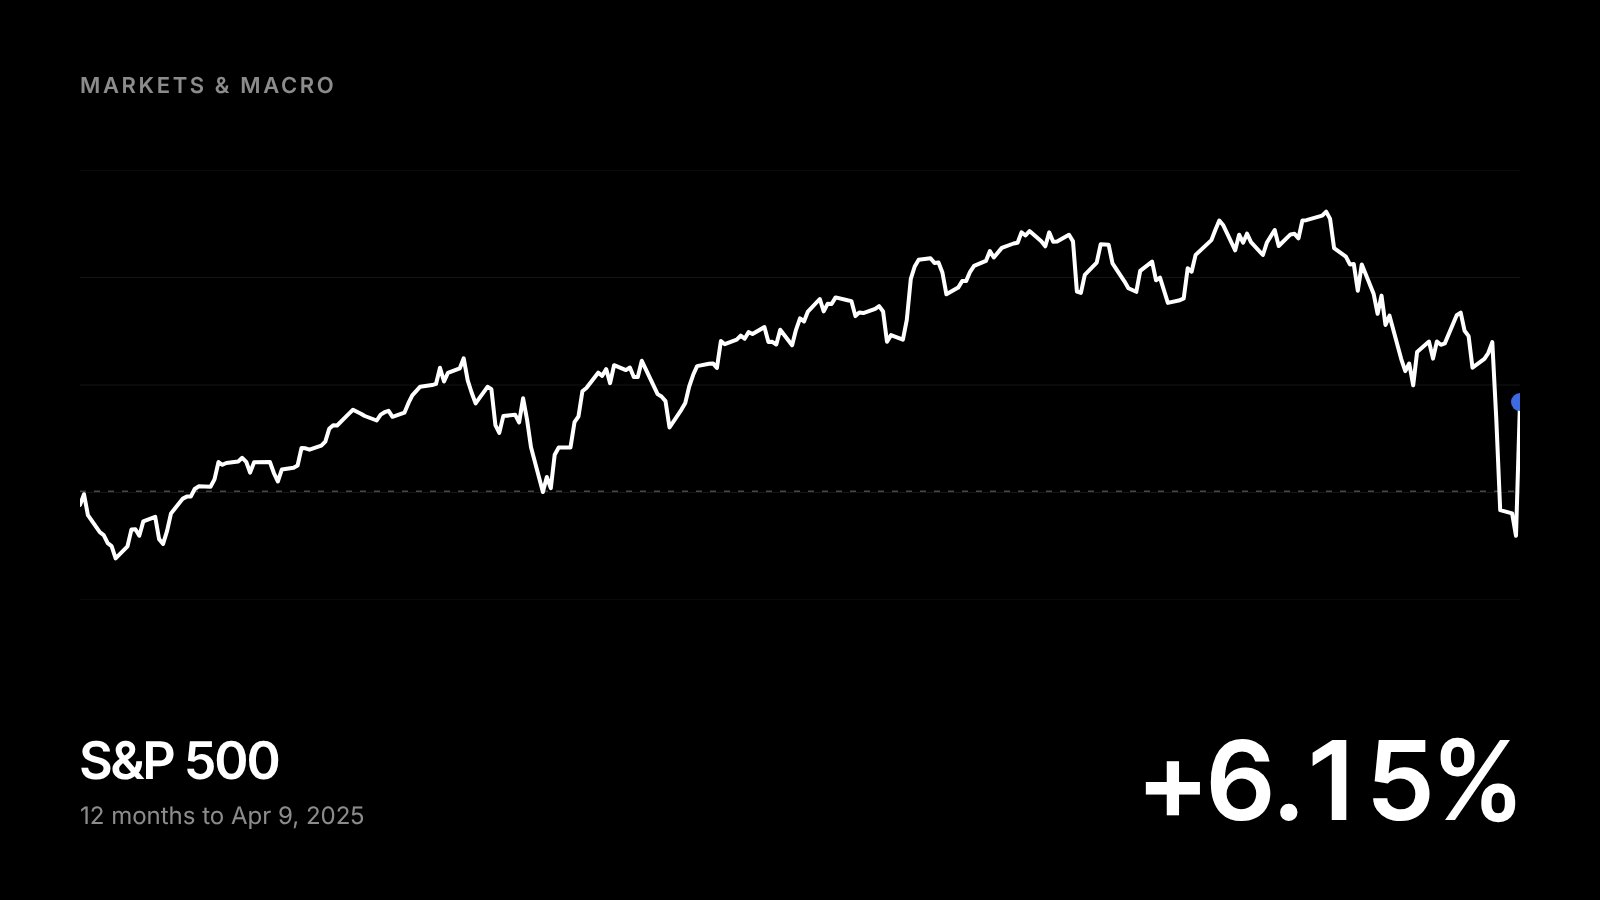
On Monday, the indicator fell to -4.33, a reading that has only occurred 13 other times since 1929. Similar extremes have triggered explosive one-day rallies, translating to a staggering 2,763% annualized return for the S&P 500.
| When the indicator is | Annualized return | Share of days |
|---|---|---|
| Above −4.25 | 10.8% | 100% |
| Below −4.25 | 2763.4% | 0.3% |
Similar oversold conditions produced a stock market rally
Whenever the capitulation indicator plunged below -4.25, the S&P 500 tended to rally over the next year. The most favorable window occurred at the six-month mark, which rose 92% of the time and displayed significance relative to random returns.
However, the world's most benchmarked index registered a loss in 8 out of 13 cases at some point in the initial month. Consequently, one should expect a choppy environment in the near term.
| Return after the signal (%) | ||||||||
|---|---|---|---|---|---|---|---|---|
| Signal date | Off high | 1 wk | 2 wk | 1 mo | 2 mo | 3 mo | 6 mo | 12 mo |
| 1929-10-29 | −35.88 | 4.6 | −5.8 | 6.0 | 1.1 | 6.9 | 26.6 | 5.2 |
| 1946-03-06 | −8.07 | 1.3 | 2.2 | 5.2 | 7.9 | 8.4 | 3.6 | −10.0 |
| 1946-09-04 | −19.69 | −2.7 | −4.3 | −3.1 | −7.8 | −7.4 | 3.8 | 2.7 |
| 1953-09-15 | −14.1 | 1.3 | 2.6 | 4.6 | 5.9 | 8.9 | 17.1 | 38.5 |
| 1957-10-11 | −17.69 | −1.5 | −0.9 | −3.3 | −1.0 | −0.7 | 2.6 | 25.5 |
| 1962-05-29 | −20.04 | 0.5 | −4.4 | −6.3 | −0.4 | 1.2 | 7.0 | 21.1 |
| 1966-08-29 | −20.76 | 3.3 | 5.1 | 3.5 | 7.6 | 7.9 | 17.6 | 24.6 |
| 1987-10-20 | −29.68 | −1.5 | 5.9 | 3.7 | 5.2 | 2.4 | 8.1 | 18.0 |
| 1998-08-31 | −19.34 | 6.9 | 8.4 | 6.2 | 13.4 | 21.6 | 28.2 | 37.9 |
| 2008-01-08 | −11.18 | −0.7 | −3.7 | −3.8 | −8.4 | −2.6 | −10.5 | −34.8 |
| 2015-08-24 | −11.15 | 4.2 | 4.0 | 2.4 | 8.4 | 10.4 | 1.9 | 15.5 |
| 2018-12-19 | −14.46 | −0.7 | 1.0 | 5.0 | 10.7 | 11.7 | 17.7 | 27.9 |
| 2020-03-12 | −26.74 | −2.9 | 6.0 | 11.3 | 15.7 | 21.0 | 34.6 | 59.0 |
| 2025-04-07 | −17.61 | |||||||
| Mean | 0.9 | 1.2 | 2.4 | 4.5 | 6.9 | 12.2 | 17.8 | |
| Median | 0.5 | 2.2 | 3.7 | 5.9 | 7.9 | 8.1 | 21.1 | |
| % positive | 54% | 62% | 69% | 69% | 77% | 92% | 85% | |
| Avg max loss | −1.9 | −4.3 | −4.9 | −5.4 | −5.4 | −5.7 | −10.0 | |
| Avg max gain | 5.1 | 5.5 | 6.9 | 8.8 | 11.4 | 16.5 | 25.3 | |
| Z-score | 0.9 | 0.7 | 1.3 | 1.6 | 2.1 | 2.4 | 1.5 | |
Over the bullish six-month window, a maximum loss of -10% was surpassed in only 2 out of 13 cases, albeit a few were close. By comparison, 9 of 13 rose more than 10%, underscoring a favorable risk-reward profile.
| Signal date | 1 wk | 2 wk | 1 mo | 2 mo | 3 mo | 6 mo | 12 mo |
|---|---|---|---|---|---|---|---|
| 1929-10-29 | 0.0 | −13.6 | −13.6 | −13.6 | −13.6 | −13.6 | −13.6 |
| 1946-03-06 | 0.0 | −0.6 | −0.6 | −0.6 | −0.6 | −0.6 | −17.9 |
| 1946-09-04 | −5.6 | −5.6 | −7.3 | −8.7 | −8.7 | −8.7 | −11.3 |
| 1953-09-15 | −0.1 | −0.1 | −0.1 | −0.1 | −0.1 | −0.1 | −0.1 |
| 1957-10-11 | −1.5 | −4.8 | −4.8 | −4.8 | −4.8 | −4.8 | −4.8 |
| 1962-05-29 | −1.4 | −4.4 | −9.9 | −9.9 | −9.9 | −9.9 | −9.9 |
| 1966-08-29 | 0.0 | 0.0 | 0.0 | −1.8 | −1.8 | −1.8 | −1.8 |
| 1987-10-20 | −3.9 | −3.9 | −3.9 | −5.5 | −5.5 | −5.5 | −5.5 |
| 1998-08-31 | 0.0 | 0.0 | 0.0 | 0.0 | 0.0 | 0.0 | 0.0 |
| 2008-01-08 | −0.7 | −5.7 | −5.7 | −8.4 | −8.4 | −10.5 | −45.9 |
| 2015-08-24 | −1.4 | −1.4 | −1.4 | −1.4 | −1.4 | −3.4 | −3.4 |
| 2018-12-19 | −6.2 | −6.2 | −6.2 | −6.2 | −6.2 | −6.2 | −6.2 |
| 2020-03-12 | −3.8 | −9.8 | −9.8 | −9.8 | −9.8 | −9.8 | −9.8 |
| 2025-04-07 | |||||||
| Mean | −1.9 | −4.3 | −4.9 | −5.4 | −5.4 | −5.7 | −10.0 |
| Median | −1.4 | −4.4 | −4.8 | −5.5 | −5.5 | −5.5 | −6.2 |
| Beyond 5% | 2 | 5 | 6 | 7 | 7 | 7 | 8 |
| Beyond 10% | 0 | 1 | 1 | 1 | 1 | 2 | 4 |
| Largest of all | −6.2 | −13.6 | −13.6 | −13.6 | −13.6 | −13.6 | −45.9 |
| Signal date | 1 wk | 2 wk | 1 mo | 2 mo | 3 mo | 6 mo | 12 mo |
|---|---|---|---|---|---|---|---|
| 1929-10-29 | 18.2 | 18.2 | 18.2 | 18.2 | 18.2 | 26.6 | 26.9 |
| 1946-03-06 | 1.9 | 2.2 | 5.2 | 9.9 | 9.9 | 12.0 | 12.0 |
| 1946-09-04 | 3.4 | 3.4 | 3.4 | 3.4 | 3.4 | 4.8 | 4.8 |
| 1953-09-15 | 1.3 | 2.6 | 4.6 | 7.7 | 9.1 | 17.1 | 38.5 |
| 1957-10-11 | 1.8 | 1.8 | 1.8 | 1.9 | 1.9 | 4.0 | 25.5 |
| 1962-05-29 | 2.7 | 2.7 | 2.7 | 2.7 | 2.9 | 7.0 | 21.4 |
| 1966-08-29 | 4.3 | 5.1 | 7.4 | 7.6 | 10.5 | 18.4 | 28.6 |
| 1987-10-20 | 9.1 | 9.1 | 9.1 | 9.1 | 10.2 | 14.7 | 18.0 |
| 1998-08-31 | 6.9 | 8.4 | 11.4 | 13.4 | 24.6 | 33.7 | 48.2 |
| 2008-01-08 | 2.2 | 2.2 | 2.2 | 2.2 | 2.2 | 2.6 | 2.6 |
| 2015-08-24 | 5.1 | 5.1 | 5.4 | 8.4 | 11.4 | 11.4 | 15.7 |
| 2018-12-19 | 0.0 | 1.0 | 6.5 | 11.1 | 13.9 | 17.8 | 27.9 |
| 2020-03-12 | 9.3 | 9.3 | 12.5 | 18.5 | 30.3 | 44.4 | 59.0 |
| 2025-04-07 | |||||||
| Mean | 5.1 | 5.5 | 6.9 | 8.8 | 11.4 | 16.5 | 25.3 |
| Median | 3.4 | 3.4 | 5.4 | 8.4 | 10.2 | 14.7 | 25.5 |
| Beyond 5% | 5 | 6 | 8 | 9 | 9 | 10 | 11 |
| Beyond 10% | 1 | 1 | 3 | 4 | 7 | 9 | 11 |
| Largest of all | 18.2 | 18.2 | 18.2 | 18.5 | 30.3 | 44.4 | 59.0 |
A closer examination of some potential scenarios
In 2018 and 2020, the S&P 500 bottomed three and seven days later. However, it's important to note that the Fed reversed its monetary policy stance in late December 2018 and initiated a whatever-it-takes bazooka policy in 2020.
V-shaped bottoms are rare and typically result from aggressive monetary or fiscal intervention. This comparison may hold weight if you anticipate a policy shift from the Fed or the Trump administration.
The 2015 instance could provide a more likely roadmap for the current scenario should the economy avoid a recession. This example represented a significant growth scare correction.
The lack of clarity around tariffs may result in choppy price action within a wide range, testing investors' patience but rewarding tactical traders.
The 2008 precedent is a worst-case scenario, with the signal appearing early in the bear market. This comparison implies that the current tariff policy will push the economy into recession later this year.
What the research tells us...
By nearly any measure, the stock market is oversold, and sentiment is deeply pessimistic, conditions that often precede a rebound. Furthermore, Monday's price action may have marked what technicians call an "internal low," when the most significant pain is felt in individual stocks, even if stock indexes haven't yet reached their final bottom. While history suggests a rally, I suspect it's a bounce within the context of a downtrend, followed by a retest. What unfolds over the next 3, 6, or 12 months will depend heavily on how well the economy holds up under this significant shock. Traders should prioritize risk management with stop losses, whereas investors can use rallies to fine-tune their market exposure until there's more insight into the economic effects of tariffs.