
September 2025 Key Perspectives on Jobs and Mixed Economic Signals
Recent jobs reports have some investors worried. Why we look past backward-looking data to the economy's foundations.
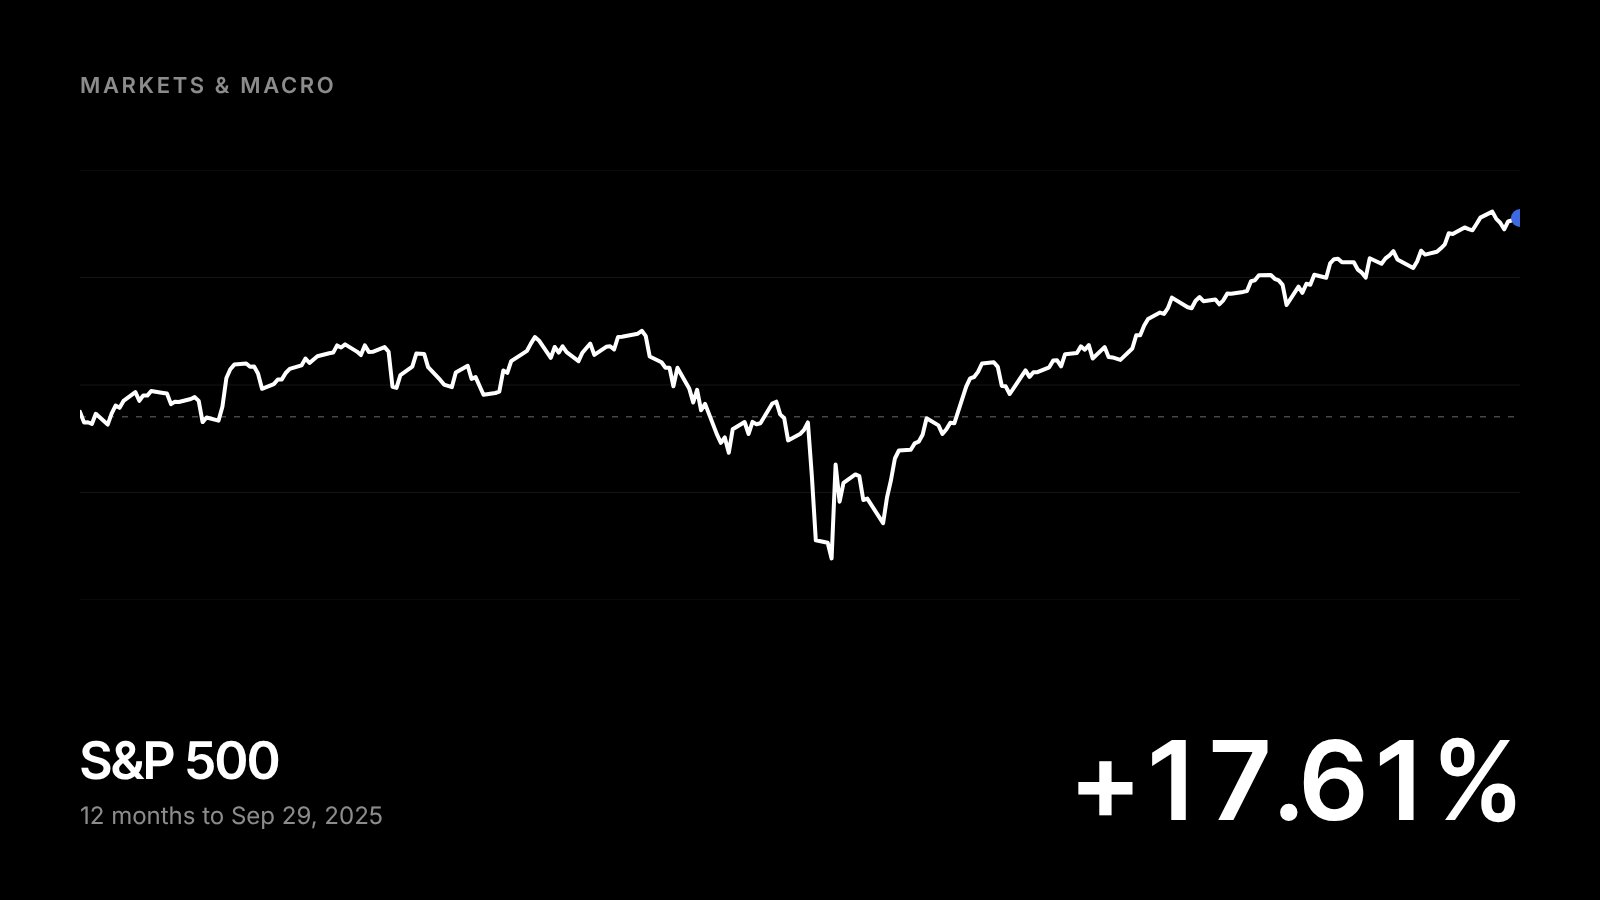
Investors often find themselves looking in the rearview mirror even when they know that what lies ahead is most important. Recent reports, which are naturally backward-looking, have some investors and policymakers concerned about the economy, leading some to wonder if there will be a recession. In today’s context, there are signs that the job market is slowing and inflation remains stubborn, even as overall unemployment remains low and broader GDP trends remain positive. For long-term investors, these mixed signals make maintaining a balanced perspective more important than ever.
Analyzing economic data is challenging, and interpreting market factors is never straightforward. In times like these, it’s helpful to focus less on headlines and instead on the foundations of the economy. Often, the first place to start is the financial health of consumers, since consumer spending drives over two-thirds of economic activity and directly impacts corporate revenues and the broader economy. How are consumers doing in today’s complex economic environment?
The Job Market has Weakened in Recent Months
To understand the financial health of consumers, it helps to look at the job market. The latest jobs report provided further evidence that the labor market is slowing more than previously expected. Only 22,000 jobs were added in August according to the Bureau of Labor Statistics, well below the 75,000 that economists had anticipated. The report also included substantial revisions to figures from previous months, with June’s payroll numbers showing the economy lost 13,000 jobs that month, marking the first decline since 2020.
While these figures are important and have been covered widely in the financial media, economists don't focus solely on headline payroll numbers, which can swing from month to month. Instead, they look at the trends and consider what's known as "labor market slack.” Put simply, this measures whether people who are looking for work can find it.
Fed Chair Jerome Powell recently described the current job market as being in “a curious kind of balance” since both the supply of workers and demand for them have slowed.1 Specifically, the fact that the unemployment rate sits at only 4.3% is a positive sign that many who would like to work are able to. The “under-employment” rate, which includes workers who have given up, is also still historically low at 8.1%. Other reports show that there is still roughly one job opening for each unemployed individual across the country. While this does not mean everyone will find a job, it shows that companies are still hiring.
This matters because, when combined with the payroll numbers, it suggests the labor market is cooling gradually rather than collapsing suddenly. The key difference is that spikes in unemployment have historically only occurred due to economic shocks, such as the 2008 financial crisis or the 2020 pandemic. In contrast, the current environment seems to reflect natural shifts in the economy. For the Fed, this employment trajectory further raises the chance of additional rate cuts beginning in September.
Consumer Finances Show Resilience Despite Challenges
While the labor market is softening, consumer finances in general are showing signs of a “two-speed economy” – one in which financial situations vary based on factors such as wealth and income. Many investors have focused on these figures because the total amount of debt continues to rise across credit cards, auto loans, student loans, and more. Greater leverage by households can be problematic if there is an economic downturn, a factor that initially sparked the financial crisis in 2008.
One way to understand if there are cracks in household finances is whether bills are being paid on time. The chart above shows that credit card and auto loan delinquencies have increased over the past two years, due partly to increased borrowing among consumers and, more recently, higher interest rates. This rise in delinquencies has also been concentrated among borrowers with lower credit scores, providing further evidence of a two-speed economy.
However, the chart also highlights the fact that these delinquency rates have plateaued more recently and remain well below levels experienced prior to 2008. And, while the total level of debt is high across the country, the amount that households are paying on their debt has remained flat in recent months. This suggests that while some households may be feeling more stretched as they pay interest and principal on their loans, these figures are not yet at levels that have historically led to recessions.
Household Net Worth Remains Near Record Levels
It’s tempting to focus only on the liability side of consumers’ balance sheets, since this is often where problems begin. However, the asset side is just as important, and U.S. household net worth remains near record levels today. This is highlighted in the chart above.
At $169 trillion, net worth has increased over the past 15 years due to steady economic growth, rising housing prices, and strong stock market returns. Again, this reflects a two-speed economy since those households that have borrowed more in recent years may not be the same households benefiting from rising asset prices. Still, this wealth effect, where rising asset values support consumer spending, can help provide economic stability. This is one reason the many concerns of the past few years have not always directly translated into a weaker economy.
This is also a reminder of what drives wealth creation over time, and why it’s important to hold a portfolio tailored to financial goals. Over this period, there were many times when investors worried about recessions. While markets can react to negative data points or experience pullbacks in the short run, they often “climb the wall of worry” in the long run. For patient investors, focusing on where the long-term economy is headed is far more important than dwelling on where it’s been.
BRIM Portfolio Update – Innovation Spotlight
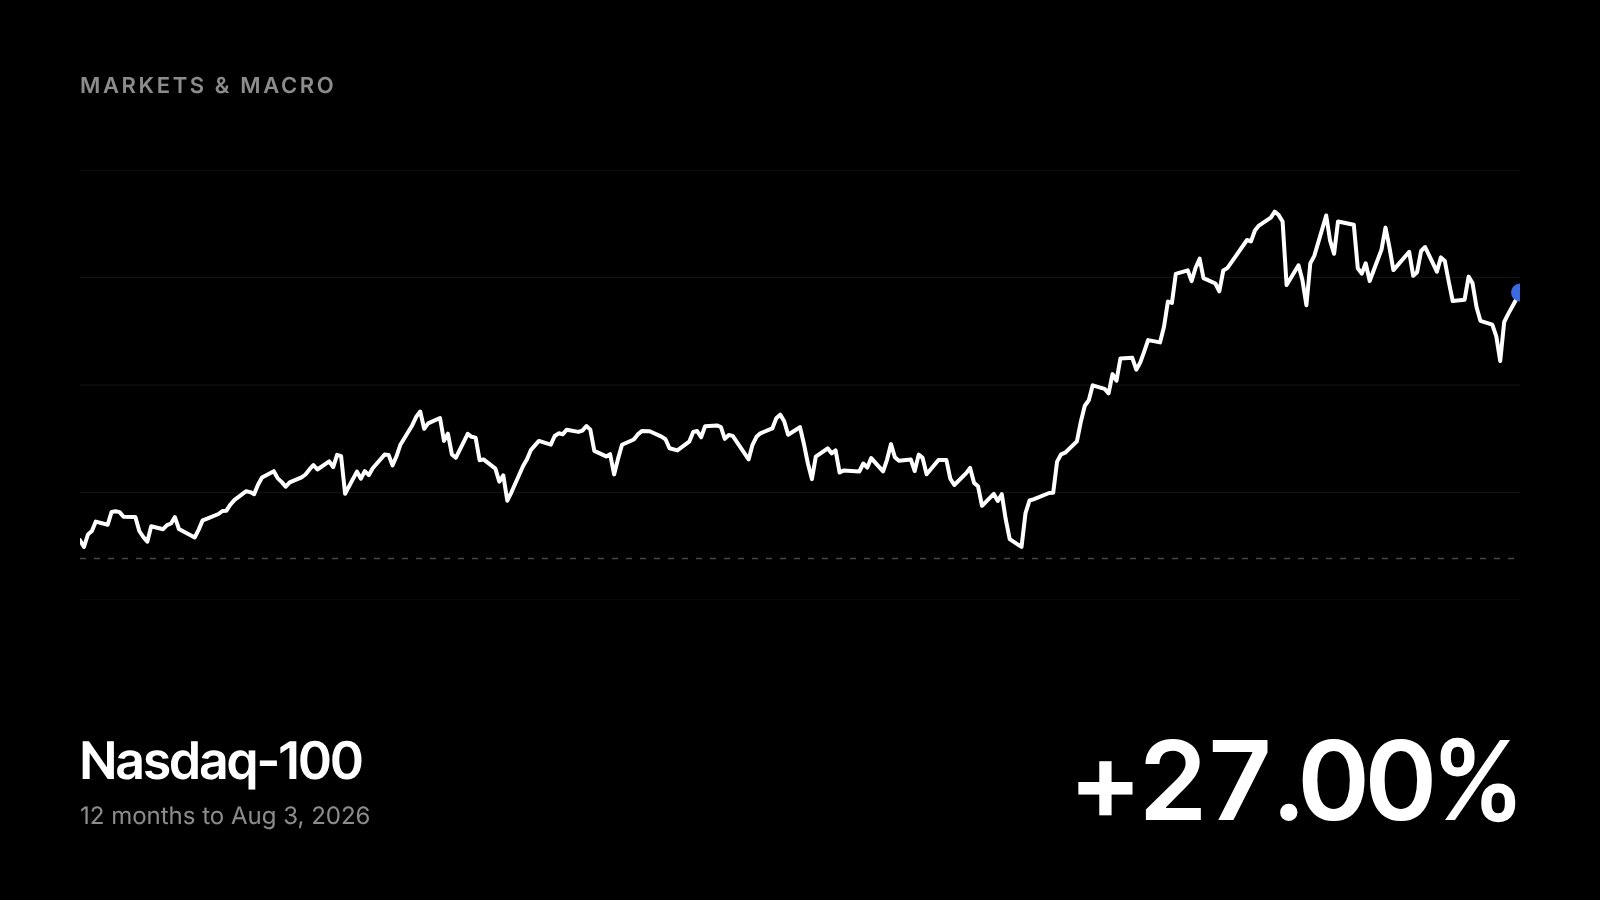
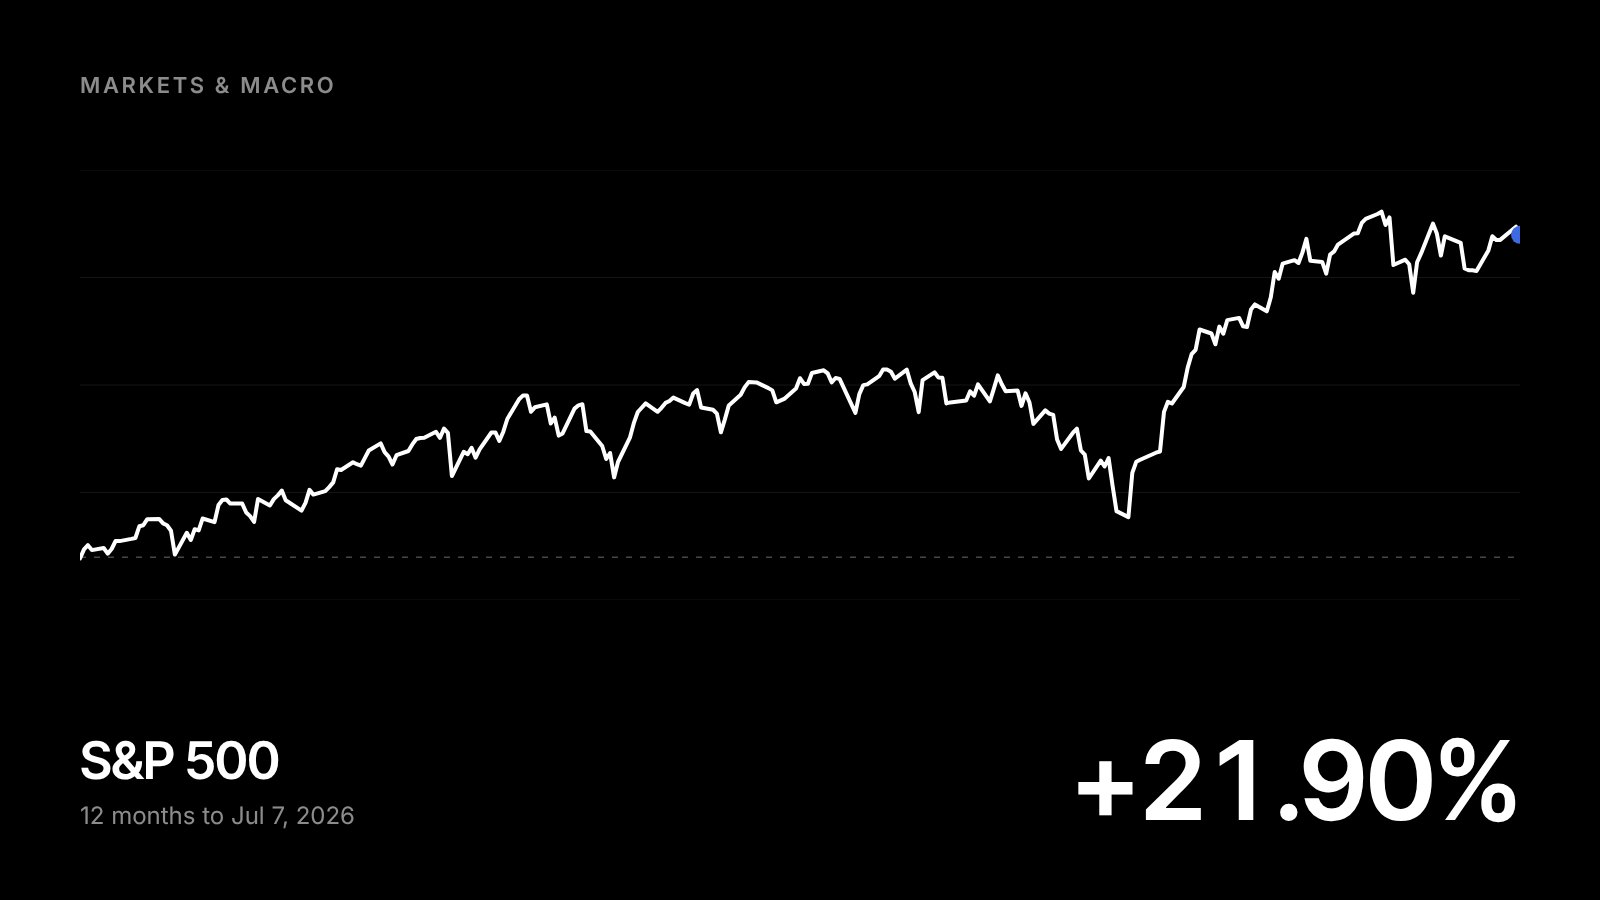
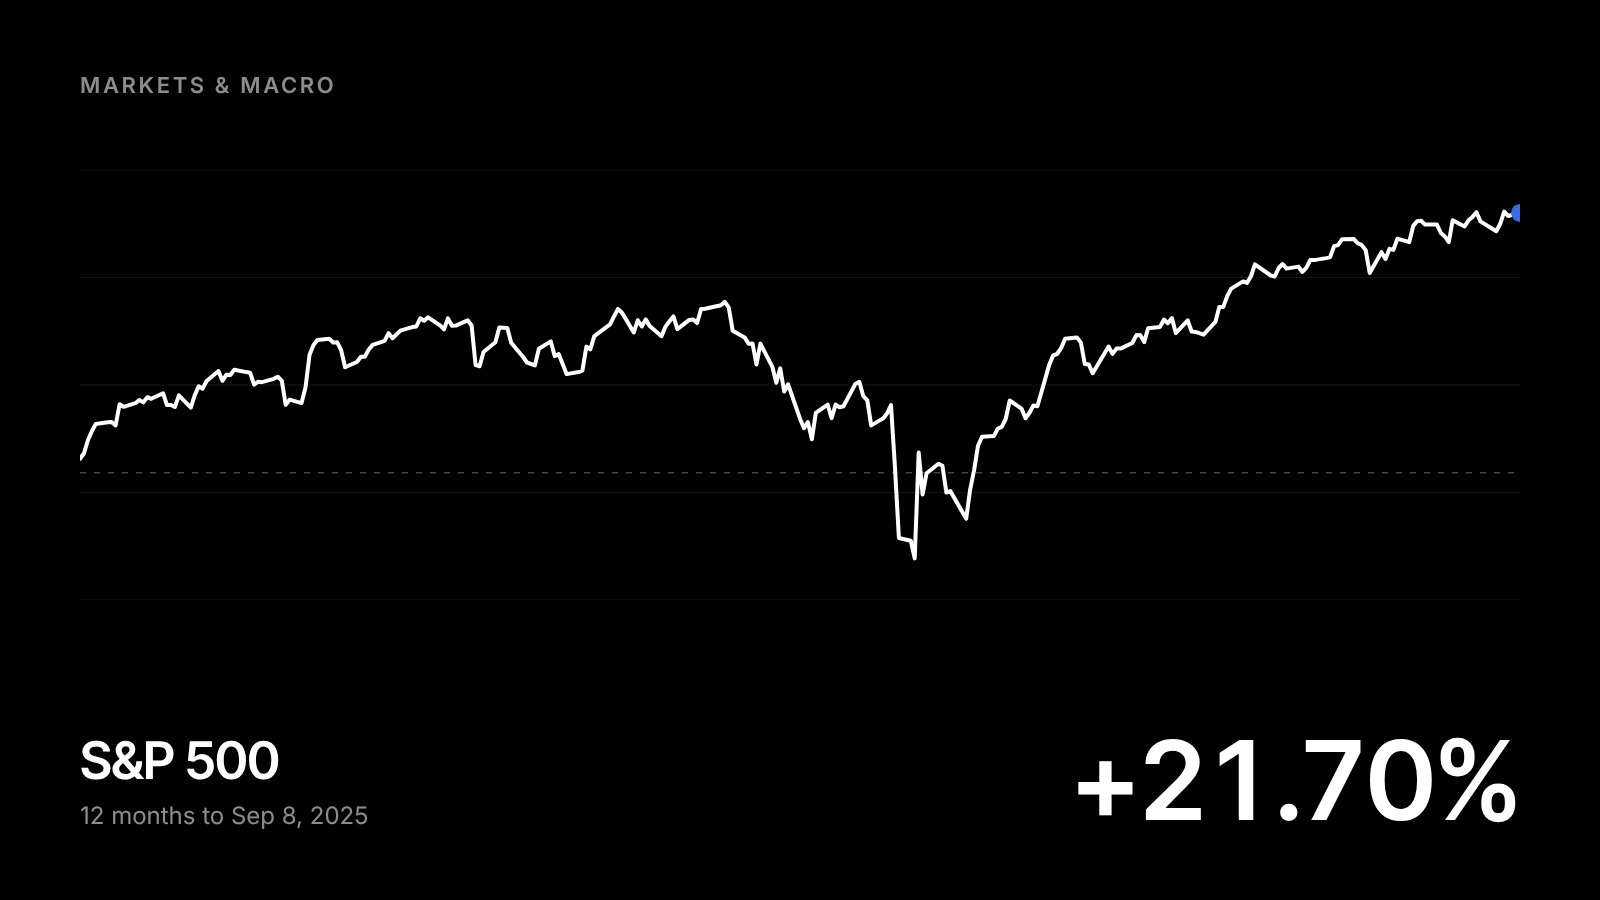
Amid this backdrop, our strategies at BRIM continue to compound well. Most notably, BRIM's Equity Innovation Portfolio is up +44.6% year-to-date through September 5th, compared to +11.2% for the S&P 500 and +12.7% for the Nasdaq 100 — nearly 4x the S&P’s return in 2025 so far.
This return is exact result of what we target: asymmetric upside by owning the top #1 and #2 leaders in sectors like artificial intelligence, cloud infrastructure, cybersecurity, and general tech innovation platforms. Every company in our Innovation Portfolio must project at least 25% annual revenue growth, and with valuations rebounding, forward return potential remains quite strong.
At the same time, our Core and Low Volatility Portfolio's continue to provide steadier compounding, balancing our Innovation Portfolio's high-growth tilt. Together, this structure adds clear long-term value on both absolute and risk-adjusted return bases.
The Bottom Line?
The bottom line? While the job market has slowed, raising the odds of Fed rate cuts beginning in September, it is only one component of the overall economic picture. When the outlook is uncertain, investors should focus on the individual companies they themselves own, and the resilience of those investments, not necessarily the overall market or the overall economy. The job market has slowed, (but has not gone negative), raising the odds of Fed rate cuts beginning in September.
There could be a near-term pullback if the broader market consolidates, but as we saw this year, once the market resets and begins to rebound, high-growth companies tend to outperform and lead the market higher into all-time highs. With forward growth still intact and valuations still at a discount, creates an additional tailwind we haven’t seen in years — one that is likely to drive continued market outperformance over the next 12 to 24 months.