
What a 20% Rally in 2 Months Really Means for Investors
The S&P 500 rallied just over 20% in two months from the April 8 low, one of the strongest runs on record. What usually follows.
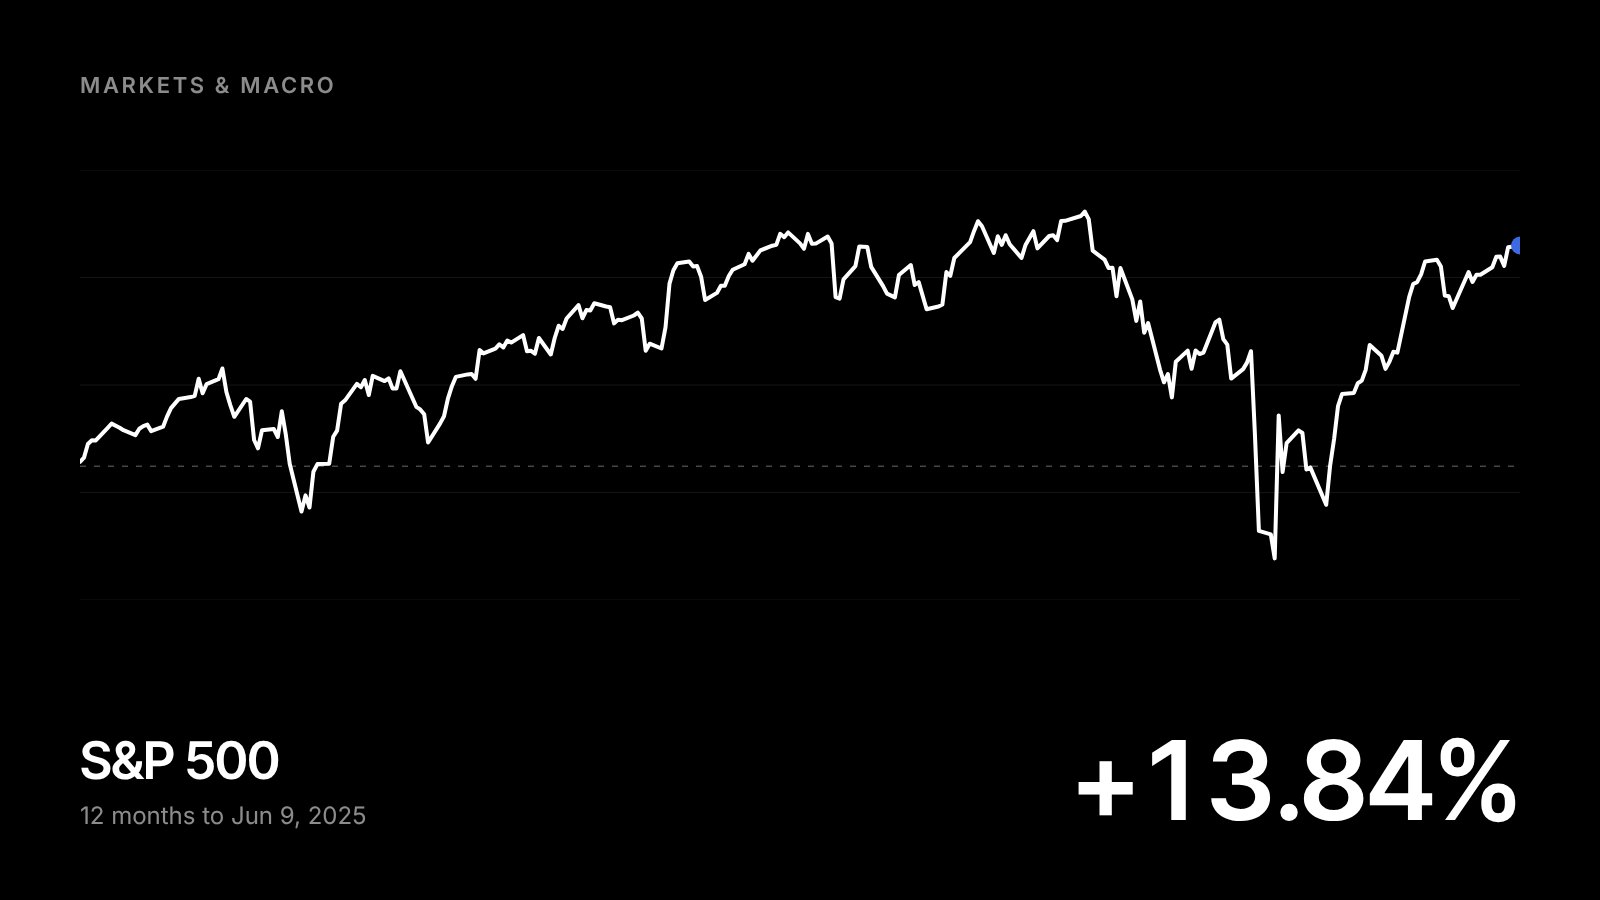
Chart of the Day - Historic Rallies
- Last Friday, the S&P 500 closed more than 20% above its April low, marking just the 11th time since WWII that the index rallied 20% from a low in less than two months.
- Today, the S&P 500 is also on pace to have just its 6th 20%+ rally over a 42-trading-day period.
- Following each of these prior moves, the S&P 500 continued higher in the months ahead and was higher a year later every time.
Section 1: A Historic Rally Takes Shape
During the market swoon from the mid-February highs through the “Liberation Day” lows, the S&P 500 never quite made it into bear market territory. But from the April 8th low through last Friday, the index rallied just over 20%, marking one of the strongest rallies off a 50-day low on record.
Section 2: What Happens After Rallies Like This?
When the S&P 500 rallies 20% or more in under two months, it usually signals serious strength ahead.
This exact setup has only happened 10 times since 1945.
In every single case, the market was higher one year later, 100% of the time, with a median return of +25.46%.
The table below tells the story — even if there was short-term volatility in the weeks that followed, over the next 3, 6, and 12 months, performance was consistently strong. These kinds of rallies tend to come at the front end of sustained uptrends, not the end.
If this move feels like “too much, too fast,” history shows there's more to come. This kind of momentum tends to show up when strength is building, and the data suggests that markets are just getting started.
After every 20%+ rally like this, the market was higher 100% of the time one year later. Median 12-month return: +25.46%:
| Date | Days since 50-day low | Below 52-week high (%) |
|---|---|---|
| 11/5/74 | 33 | −29.82 |
| 2/5/75 | 61 | −20.84 |
| 9/14/82 | 33 | −2.57 |
| 3/5/91 | 55 | 0.00 |
| 11/19/98 | 42 | −2.88 |
| 8/22/02 | 30 | −18.75 |
| 11/21/02 | 43 | −20.36 |
| 12/8/08 | 18 | −39.99 |
| 3/23/09 | 14 | −42.32 |
| 4/8/20 | 16 | −18.79 |
| 6/6/25 | 59 | −2.32 |
| Mean | −18.06 | |
| Median | −18.79 |
| Next 12 mo | |||||||
|---|---|---|---|---|---|---|---|
| Date | 1 wk | 1 mo | 3 mo | 6 mo | 1 yr | Gain | Drop |
| 11/5/74 | −1.92 | −11.96 | 5.11 | 19.93 | 18.69 | 27.29 | −13.51 |
| 2/5/75 | 1.23 | 5.00 | 14.10 | 9.22 | 27.16 | 29.08 | −0.75 |
| 9/14/82 | 1.45 | 9.32 | 11.61 | 22.53 | 34.33 | 38.90 | −2.16 |
| 3/5/91 | −1.78 | −0.36 | 2.22 | 3.30 | 7.91 | 11.69 | −2.70 |
| 11/19/98 | 2.97 | 3.07 | 7.51 | 16.62 | 23.37 | 23.63 | −0.98 |
| 8/22/02 | −4.66 | −12.19 | −3.34 | −11.90 | 3.15 | 5.09 | −19.76 |
| 11/21/02 | 0.55 | −4.07 | −9.17 | −1.11 | 10.87 | 13.41 | −14.30 |
| 12/8/08 | −4.52 | 0.00 | −24.88 | 3.24 | 20.03 | 22.09 | −26.24 |
| 3/23/09 | −4.30 | 3.52 | 8.77 | 28.92 | 42.68 | 42.68 | −4.39 |
| 4/8/20 | 1.21 | 6.54 | 15.27 | 25.34 | 48.99 | 50.14 | −0.48 |
| 6/6/25 | |||||||
| Mean | −0.98 | −0.11 | 2.72 | 11.61 | 23.72 | 26.40 | −8.53 |
| Median | −0.61 | 1.54 | 6.31 | 12.92 | 21.70 | 25.46 | −3.54 |
| % up | 50 | 60 | 70 | 80 | 100 | 100 | 0 |
Section 3: Narrowing the Selecion Data
The S&P 500's two-month performance from its 2025 low ranks among the strongest since 1953, with a 20%+ gain, marking only the fifth such occurrence in history. This analysis, based on 42-trading day periods, notes a near-20% gain in 1991 (19.7%).
Fewer 20%+ rallies appear here compared to the previous analysis, as that one included rallies in two months or less, capturing instances where gains later pulled back.
Section 4: Why This Rally Is Different
The chart below identifies fewer 20%+ rallies (five) compared to initial analysis citing ten, because this study requires gains to be sustained over exactly 42 trading days, excluding shorter rallies or those that pulled back before two months. The S&P 500's two-month performance from its 2025 low ranks among the strongest since 1953, achieving a 20%+ gain, which would mark only the fifth such occurrence in a fixed 42-trading-day period, provided the index does not close below 5,979. This analysis notes a near-20% gain in 1991 (19.7%).
The previous analysis included rallies of 20% or more in two months or less from a 50-trading-day low, capturing more instances, like those after the Covid (2020) and Financial Crisis (2008-2009) lows, where rapid surges often occurred but sometimes declined before a full two months.
One, three, six, and twelve months later, performance was even stronger and more consistent to the upside, with gains over all four timeframes in all five periods!
| S&P 500 return after (%) | ||||||
|---|---|---|---|---|---|---|
| Date | Rally (%) | 1 week | 1 month | 3 months | 6 months | 1 year |
| 2/6/75 | 20.84 | 3.12 | 6.53 | 12.83 | 9.79 | 26.60 |
| 10/6/82 | 22.43 | 7.67 | 11.96 | 14.41 | 18.96 | 34.11 |
| 12/7/98 | 22.36 | −3.92 | 6.91 | 7.39 | 12.36 | 18.65 |
| 4/30/09 | 24.54 | 3.96 | 5.31 | 13.05 | 18.72 | 35.96 |
| 5/18/20 | 23.18 | 0.05 | 5.46 | 14.76 | 20.78 | 39.74 |
| 6/9/2025 | 20.44 | |||||
| Average | 2.18 | 7.23 | 12.49 | 16.12 | 31.01 | |
| Median | 3.12 | 6.53 | 13.05 | 18.72 | 34.11 | |
Section 5: What Comes Next?
The natural question after a 20% surge is: now what? This chart shows how the S&P 500 performed in the 12 months following each of the past five two-month rallies of 20% or more, specifically the same five instances identified earlier (2/6/75, 10/6/82, 12/7/98, 4/30/09, and 5/18/20, with 6/9/2025 as the potential current rally).
The takeaway is clear — these rallies weren’t the end of the move. In most cases, they were just the beginning of a much longer climb. While there’s always some short-term noise, momentum like this typically points to sustained performance above historical averages.
Bottom Line: The S&P 500’s recent 20%+ rally from its April low ranks among the fastest and strongest rebounds in modern history — something that’s only happened a handful of times since 1945.
A 20% two month return in the marker occurred in the S&P 500 while the index was already near a 52-week high, signaling unusually strong momentum. Historically, rallies like this have often been followed by choppy short-term performance, but over the next 3, 6, and 12 months, markets were consistently higher — with a median one-year return of 25.46%