
How Carry Trades and Market Fragility Impact Investors
How the unwinding of the yen carry trade added to the August 2024 pullback, and why the fundamentals still held up.
How Carry Trades and Market Fragility Impact Investors
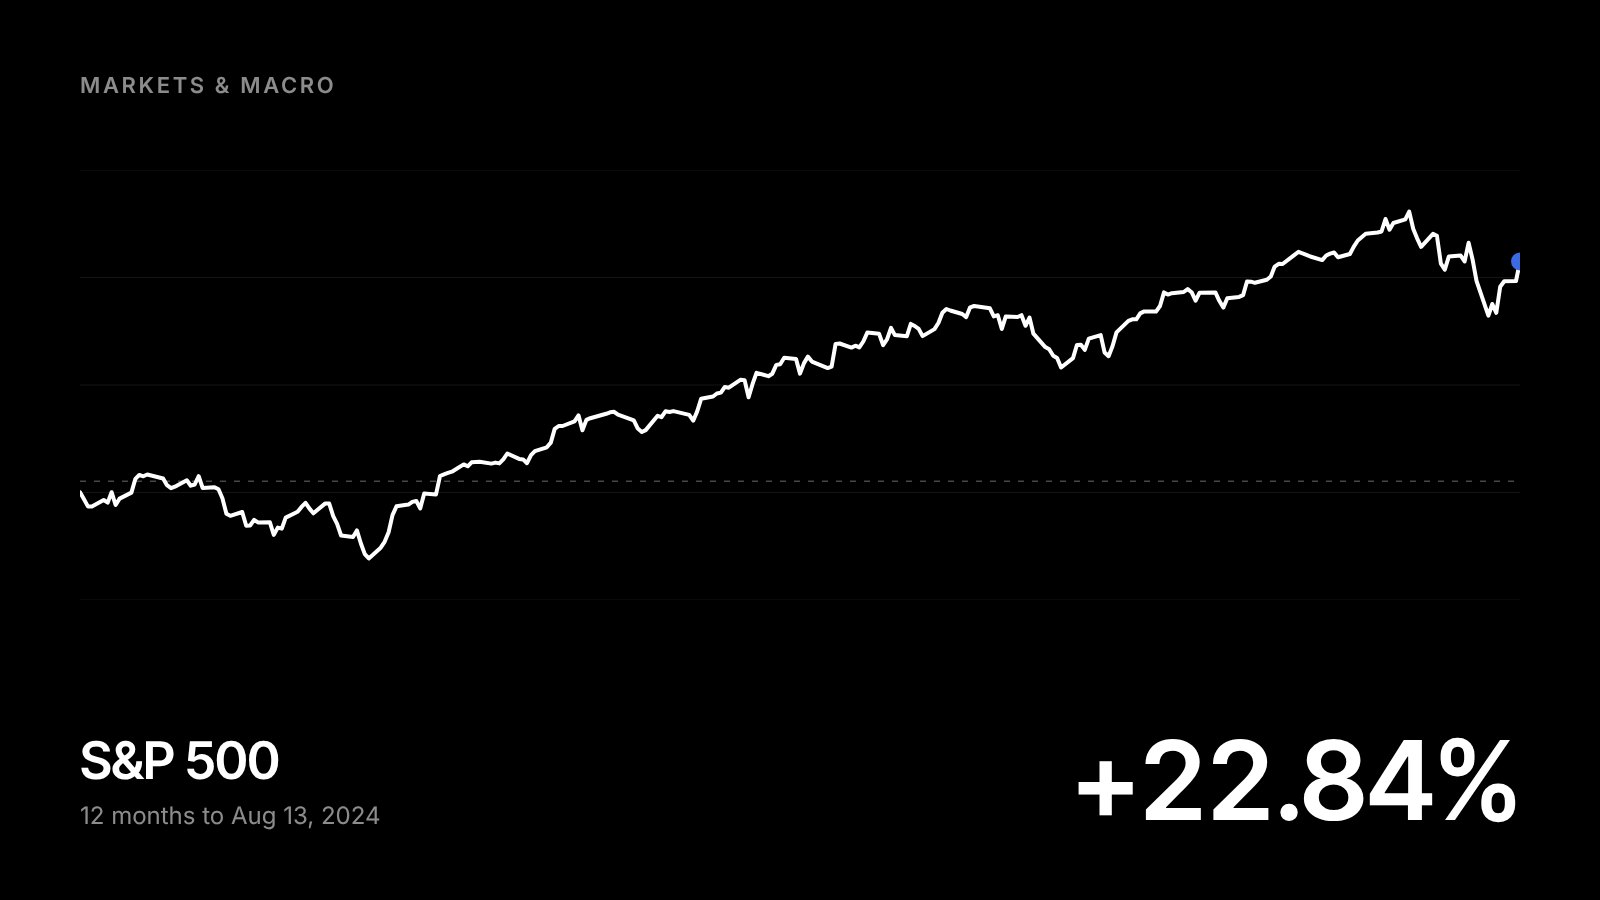
The financial markets have been feeling a bit shaky recently, with some investors expressing concerns about the economy, the timing of Fed rate cuts, and a few disappointing tech earnings reports. However, there's plenty of reason to stay optimistic. Despite last week's market volatility, major indices barely budged from Monday to Friday. While they're down slightly from their all-time highs, the S&P 500, Nasdaq, and Dow are still showing solid gains for the year, up 13%, 12%, and 6% with dividends, respectively. This is a powerful reminder that while market swings can be uncomfortable, keeping our eyes on the long-term horizon is the best way to stay focused on our goals.
Beyond the economic fundamentals, recent market technicals might have contributed to the recent pullback, particularly with the unwinding of the Japanese carry trade. While this topic has been widely covered in the financial press, it's a perfect example of how technical factors can influence short-term market moves, even as long-term fundamentals continue to drive returns. But what exactly is a carry trade, and why has it been in the spotlight?
The Unwinding of the Japanese Carry Trade
At first glance, the concept of a carry trade might seem complex, but it’s quite straightforward. Essentially, a carry trade involves borrowing at low interest rates and investing at higher rates, earning the difference. This often requires buying and selling currencies, as investors look for the best government bonds around the globe. Carry trades become particularly attractive when there’s a significant gap in interest rates and currency stability.
For decades, borrowing in Japanese yen for the carry trade has been popular because Japan's interest rates have been extremely low. Until recently, the Bank of Japan's policy rate had been negative since 2016 and hadn't surpassed 0.1% since 2008. The highest it has been this century is 0.5%. These low rates were due to factors like deflation risks, sluggish growth, and demographic challenges—what some refer to as Japan’s “lost decades.”
But things are changing. Rising inflation has prompted the Bank of Japan to raise rates to 0.25%, just as the Fed is expected to cut rates. This reduces the interest rate gap between the U.S. and Japan, while the yen has also strengthened, particularly during market volatility. These changes make the carry trade less appealing, as the rate differential shrinks and borrowing costs rise. It's worth noting that the yen’s strength is typically quoted as the number of yen per U.S. dollar—a higher number indicates a weaker yen.
Recent Volatility and Financial Leverage
While the unwinding of a single trade wouldn’t usually spark widespread concern, the use of financial leverage in carry trades can amplify their impact. This concept has worsened market crises in the past, from the 2008 global financial crisis to the 1997 Asian currency crisis, and even the 1929 crash.
Economist Hyman Minsky once said, "the more stable things become, and the longer things are stable, the more unstable they will be when the crisis hits." This is evident in the history of the carry trade, which is built on decades-long trends. The longer a trade works, the more confident investors become, increasing their stakes—much like a gambler on a hot streak. Eventually, a “Minsky Moment” occurs, where the unwinding of the trade is intensified by leverage. After a cooling-off period, investors typically return, and the cycle begins anew.
This highlights the importance of monitoring financial stability and recognizing the potential risks of excessive optimism in the markets. We saw this recently during the “everything rally” of 2021, following the pandemic. Such periods are marked by exuberance that can become detached from economic fundamentals.
However, it’s crucial to remember that not every market fluctuation leads to a crisis on the scale of 2008 or 2020. Many economic cycles see periods of expansion and contraction without major upheavals. Last year’s banking crisis is a recent example of a serious issue that ultimately stabilized. So while vigilance is key, it’s equally important to maintain a balanced perspective and recognize that markets have a remarkable ability to overcome challenges.
Market Pullbacks: A Natural Part of Investing
The major stock indices may be below their recent highs, and investor unease could persist for a while. The Nasdaq is in correction territory, down 10% from its peak, while the S&P 500 is halfway there. But history tells us that pullbacks and corrections are not only normal—they're often healthy. They allow markets to adjust to new economic data and company performance. On average, corrections involve a 14% decline, which typically recovers within four months. The key is that recoveries often begin when investors least expect them.
So, while daily market swings can be unsettling, it’s far more important to focus on the bigger picture. The unwinding of the Japanese carry trade may have sent ripples through the markets, but there are signs of stabilization. By focusing on the business cycle, corporate earnings, and underlying market trends, we can see beyond short-term volatility and stay on track to achieve our financial goals.
The Bottom Line?
Markets have felt a bit fragile lately, but there are plenty of reasons to stay positive. Instead of worrying about short-term fluctuations, let’s keep our eyes on the long-term trends that will drive our success. We’re invested in the future—especially in the transformative power of technology, which continues to shape our world in incredible ways.